← All course materialsLecture 05 · BJT characterization & biasingReading notes →

Lecture 05: BJT Characterization and Biasing

1 / 35
PHYS 252 · Lecture 0501

Lecture 05

BJT Characterization and Biasing

Inside the BJT · the DMM test · current gain · base bias · output curves · divider bias · measuring · temperature

© Ran Yang, Ph.D.Electronics
PHYS 252 · Lecture 0502

Part 1 · Lab 5 in five tasks
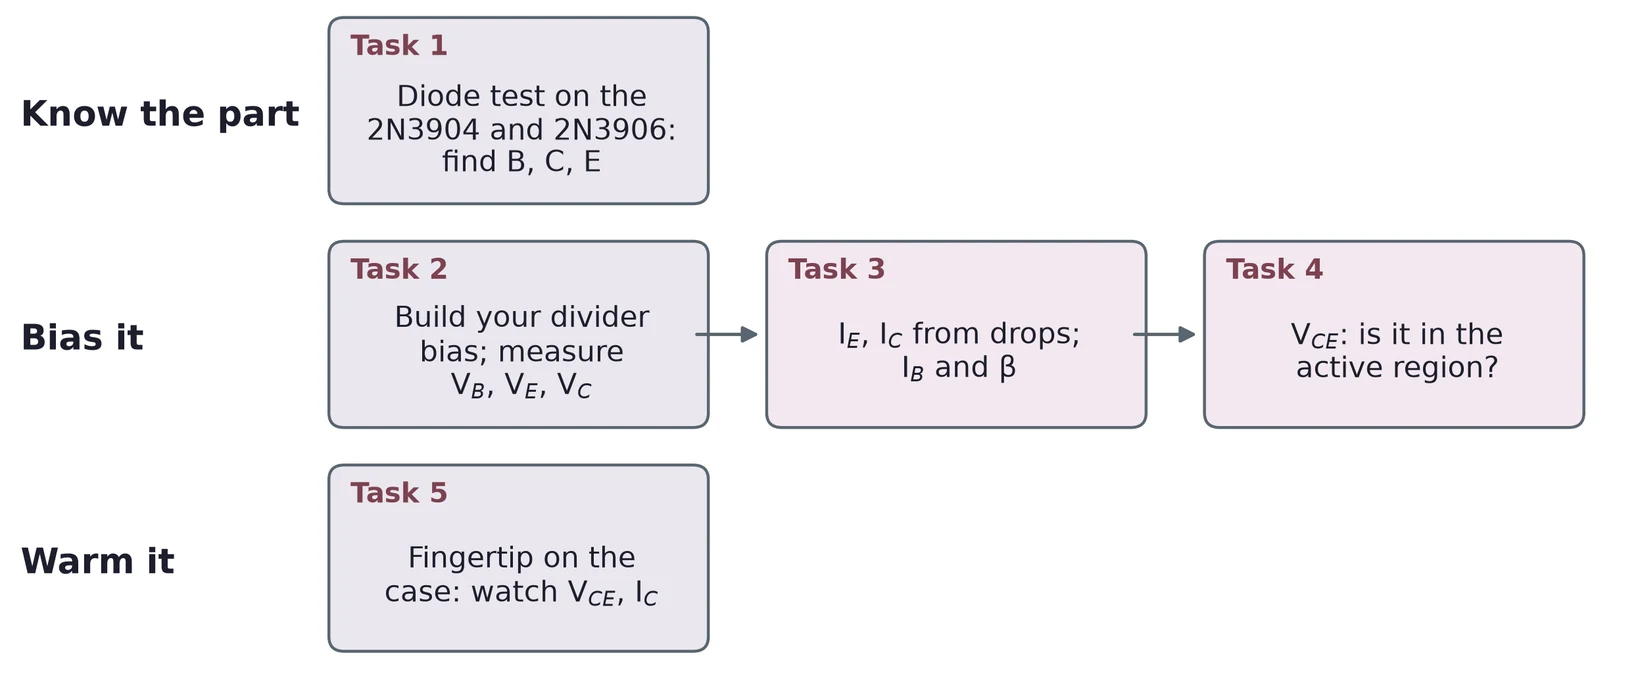
Lab 5 in three rows. Know the part: Task 1, a diode test on the 2N3904 and 2N3906 to find base, collector and emitter. Bias it: Task 2, build your divider bias and measure V_B, V_E and V_C; Task 3, find I_E and I_C from voltage drops, then I_B and beta; Task 4, check from V_CE that the transistor is in the active region. Warm it: Task 5, a fingertip on the case while you watch V_CE and I_C.

First you find the leads of two transistors with the DMM. Then you bias one, measure it, and check where it sits. Last, you warm it and watch it drift.

© Ran Yang, Ph.D.Electronics
PHYS 252 · Lecture 0503

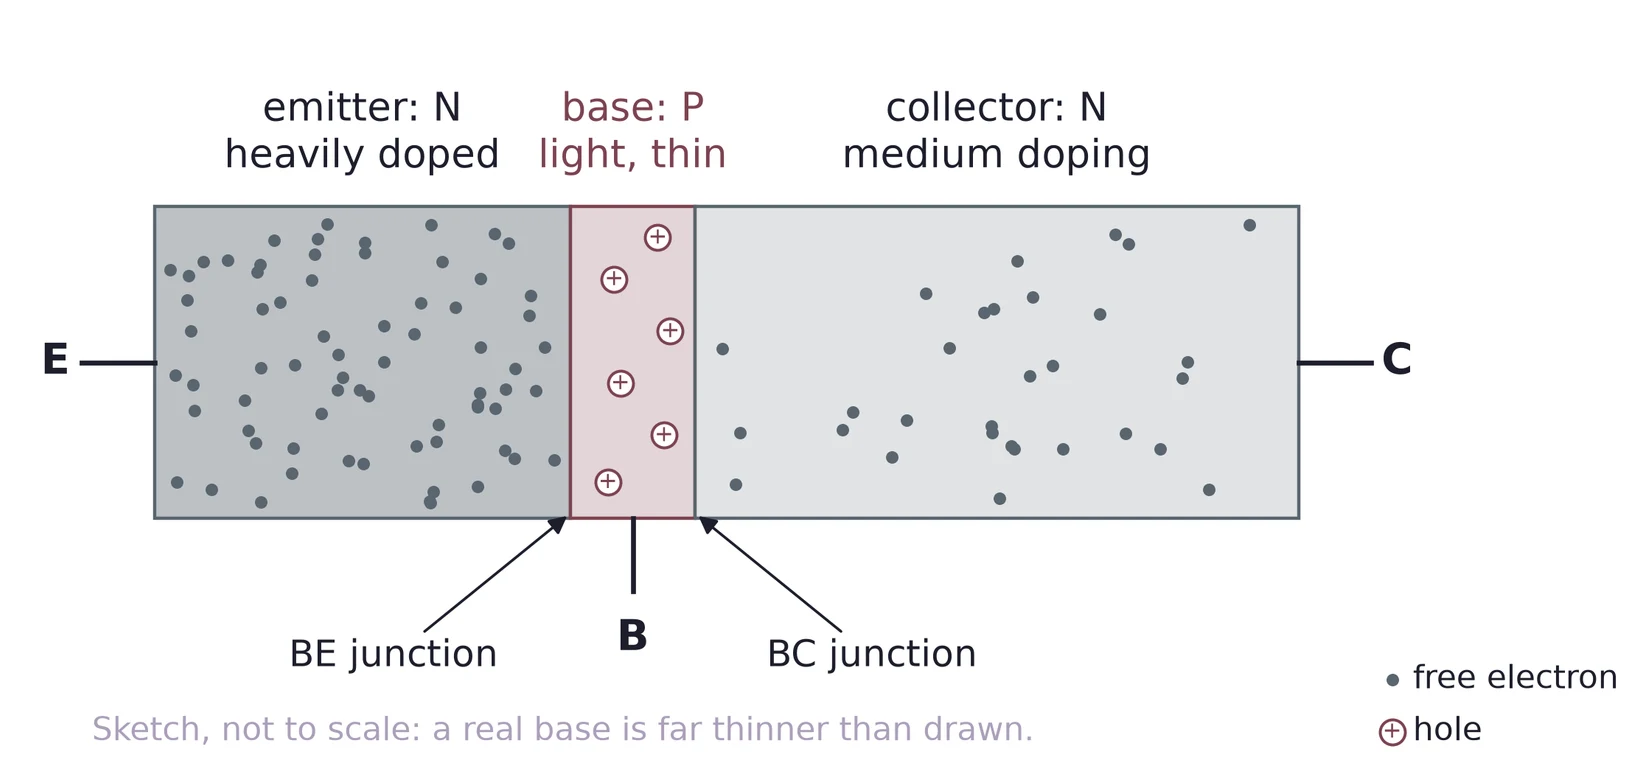
Three layers, two junctions

Sketch of an NPN transistor as three blocks in a row: the emitter, N type and heavily doped, crowded with free electrons; a thin base, P type and lightly doped, with a few holes; and the collector, N type with medium doping and fewer electrons. Arrows mark the BE junction and the BC junction; leads E, B and C come out of the three regions. A note says the sketch is not to scale and a real base is far thinner.

Bipolar junction transistor (BJT): an NPN is two PN junctions back to back, sharing one thin P layer, the base.

© Ran Yang, Ph.D.Electronics
PHYS 252 · Lecture 0504

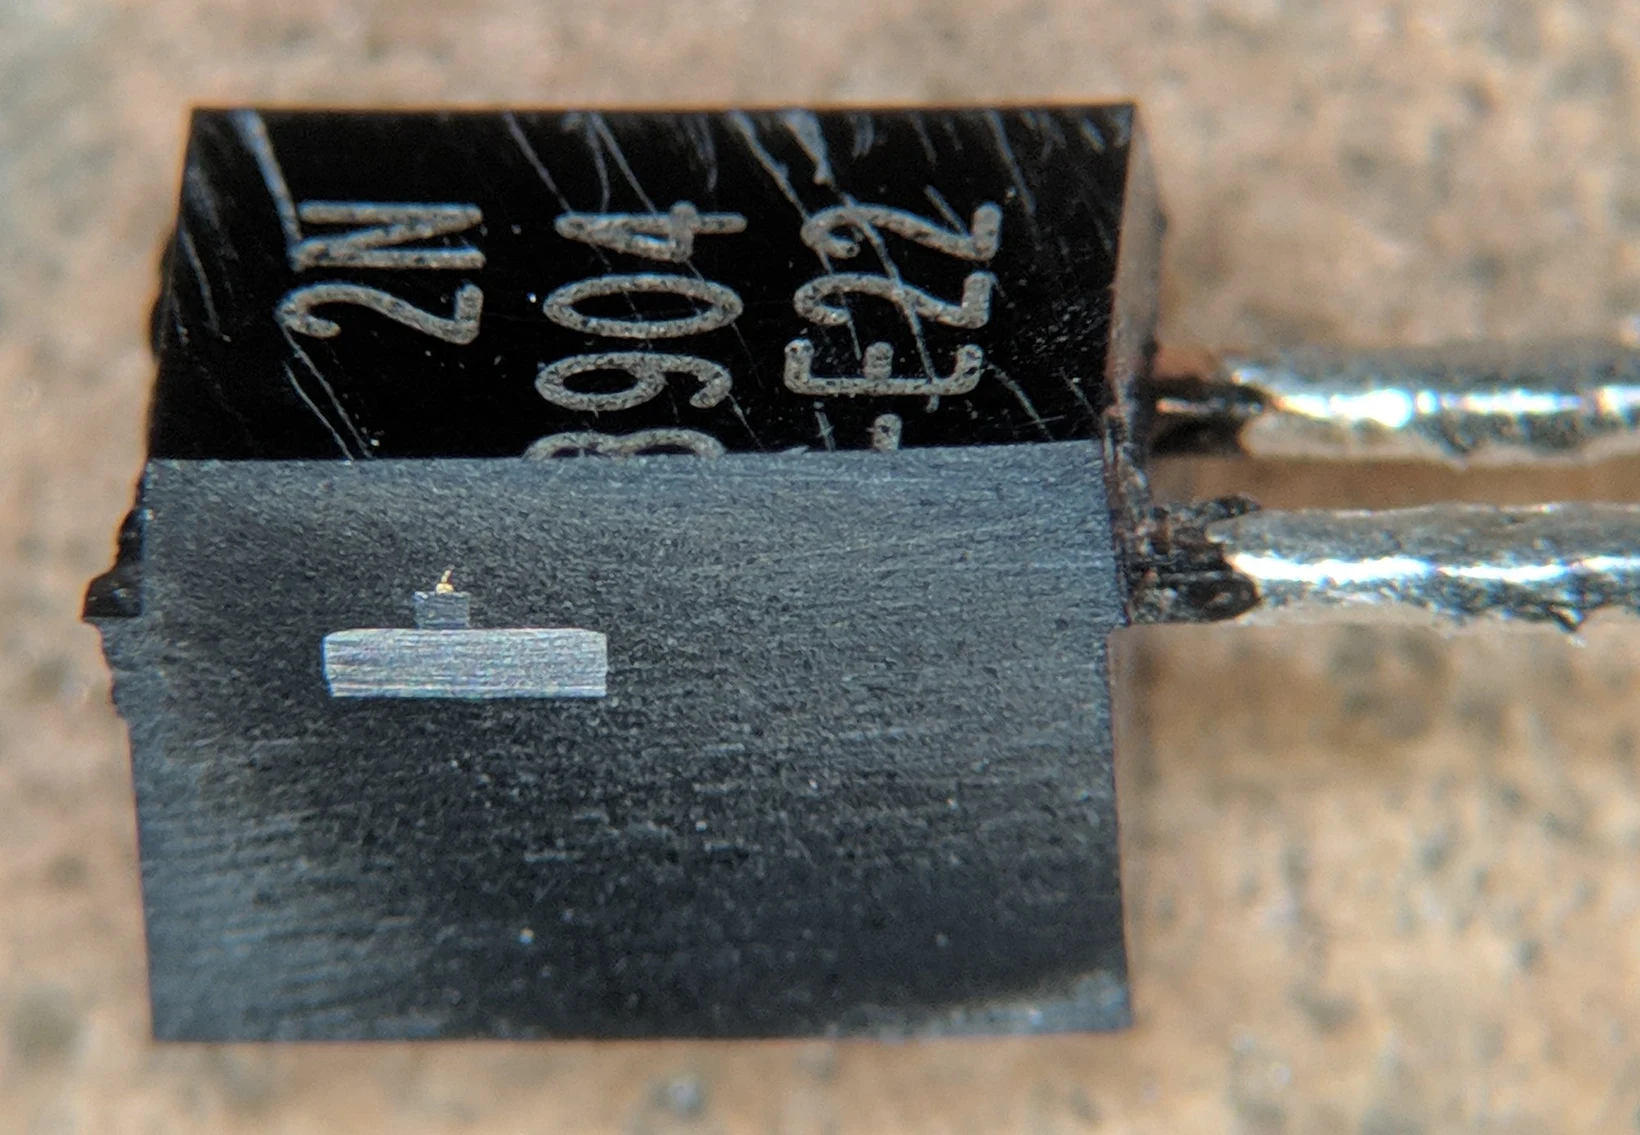
Inside a real 2N3904

A 2N3904 in its black plastic case, ground down to show a cross section. A small bright rectangle in the middle is the metal slug that carries the silicon die, with a fine bond wire above it; two leads leave the case on the right.

The case is cut open.

The small gray chip on the bright metal slug is the silicon die.

The slug is the collector. A thin bond wire reaches the emitter.

Photo: TubeTimeUS, CC BY-SA 4.0.

© Ran Yang, Ph.D.Electronics
PHYS 252 · Lecture 0505

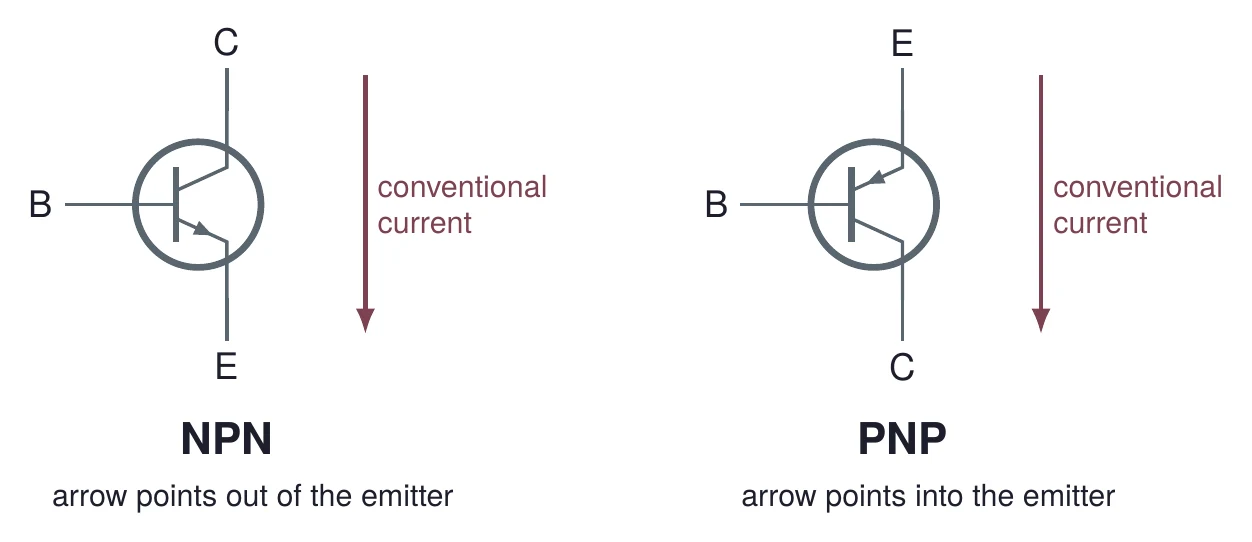
NPN and PNP symbols

Circuit symbols for an NPN and a PNP transistor, each in a circle with base B on the left. NPN: collector at the top, emitter at the bottom, the emitter arrow pointing out. PNP: emitter at the top, collector at the bottom, the emitter arrow pointing in. Beside each, a downward arrow marks the direction of conventional current.

The arrow sits on the emitter and points the way conventional current flows through the BE junction: out of an NPN, into a PNP.

© Ran Yang, Ph.D.Electronics
PHYS 252 · Lecture 0506

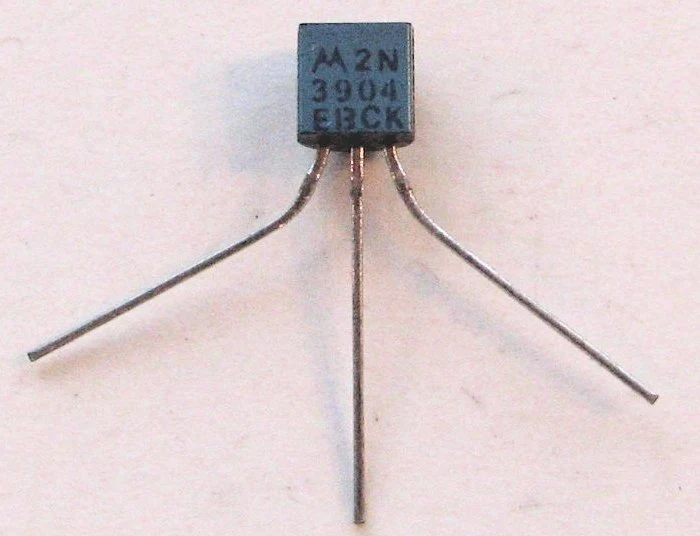
The 2N3904 in a TO-92 package

A 2N3904 transistor in a small black TO-92 plastic package with its flat face toward the camera, marked 2N 3904, and three bent wire leads spread below it.
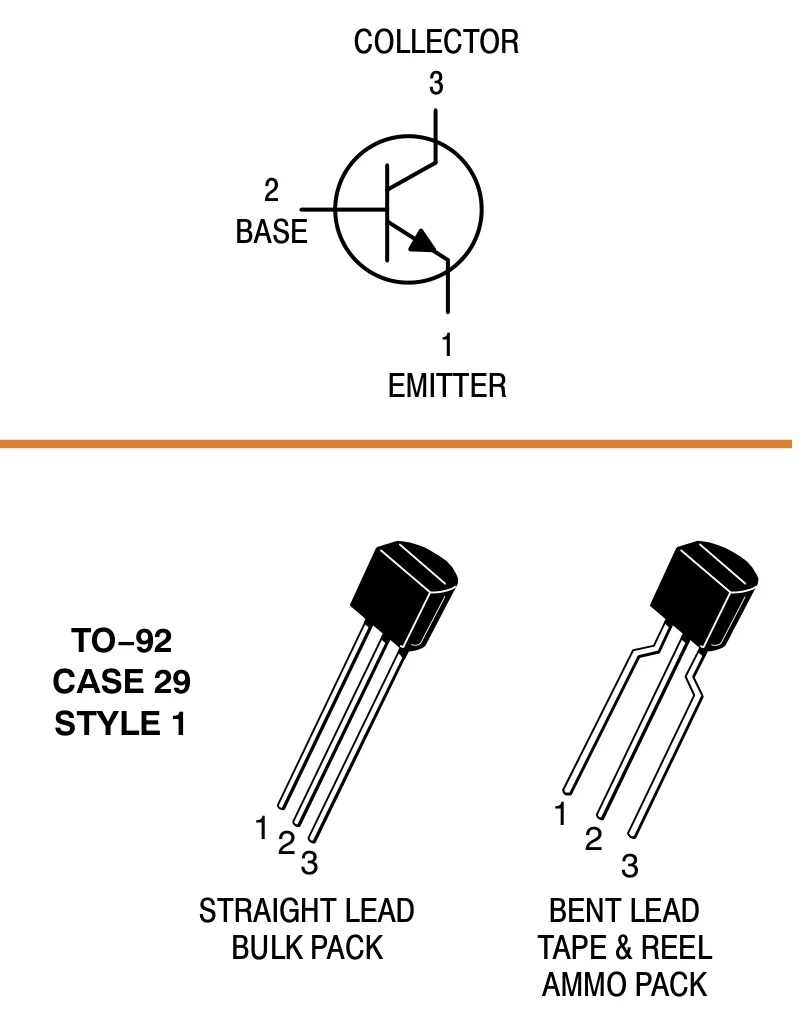
From the onsemi 2N3903 and 2N3904 datasheet: the NPN symbol with pin numbers, collector 3, base 2 and emitter 1, and drawings of the TO-92 package with straight leads and with bent leads, the leads numbered 1, 2, 3.

Flat side toward you: E, B, C, as on the 2N3906. Photo: Windell Oskay, CC BY 2.0; onsemi 2N3903/D, p. 1.

© Ran Yang, Ph.D.Electronics
PHYS 252 · Lecture 0507

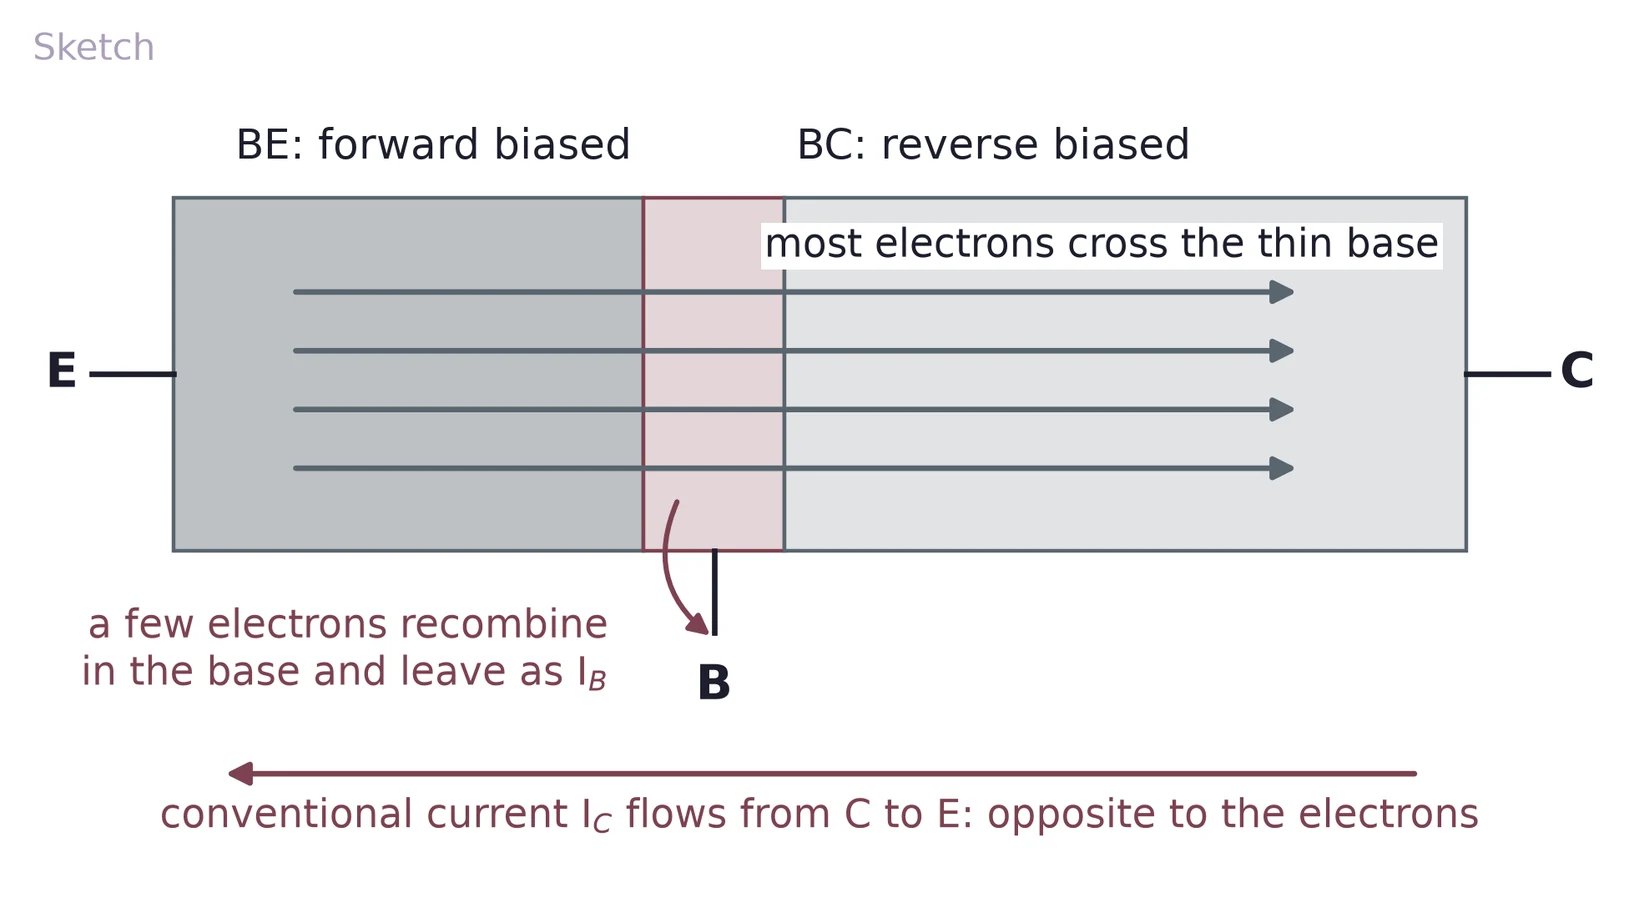
Electrons cross the thin base

Sketch of electron flow in an NPN. The BE junction is forward biased and the BC junction reverse biased. Four arrows carry electrons from the emitter across the thin base into the collector; a curved arrow shows a few electrons recombining in the base and leaving through the base lead as I_B. Below, an arrow pointing the other way shows conventional current I_C flowing from collector to emitter, opposite to the electrons.

The forward-biased BE junction injects electrons into the base. The base is so thin that most of them reach the BC junction and are swept into the collector.

© Ran Yang, Ph.D.Electronics
PHYS 252 · Lecture 0508

Three currents, one node

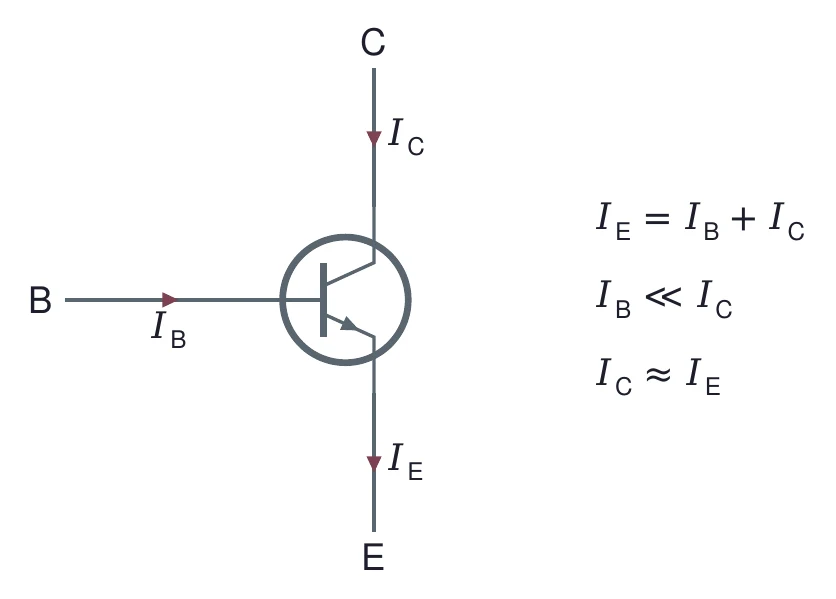
An NPN transistor with three current arrows: I_B flows into the base, I_C flows into the collector, and I_E flows out of the emitter. Beside it: I_E = I_B + I_C, I_B is much less than I_C, and I_C is about equal to I_E.

Kirchhoff's current law for the whole transistor: what flows in at B and C flows out at E.

© Ran Yang, Ph.D.Electronics
PHYS 252 · Lecture 0509

Part 2 · To the meter, a BJT is two diodes
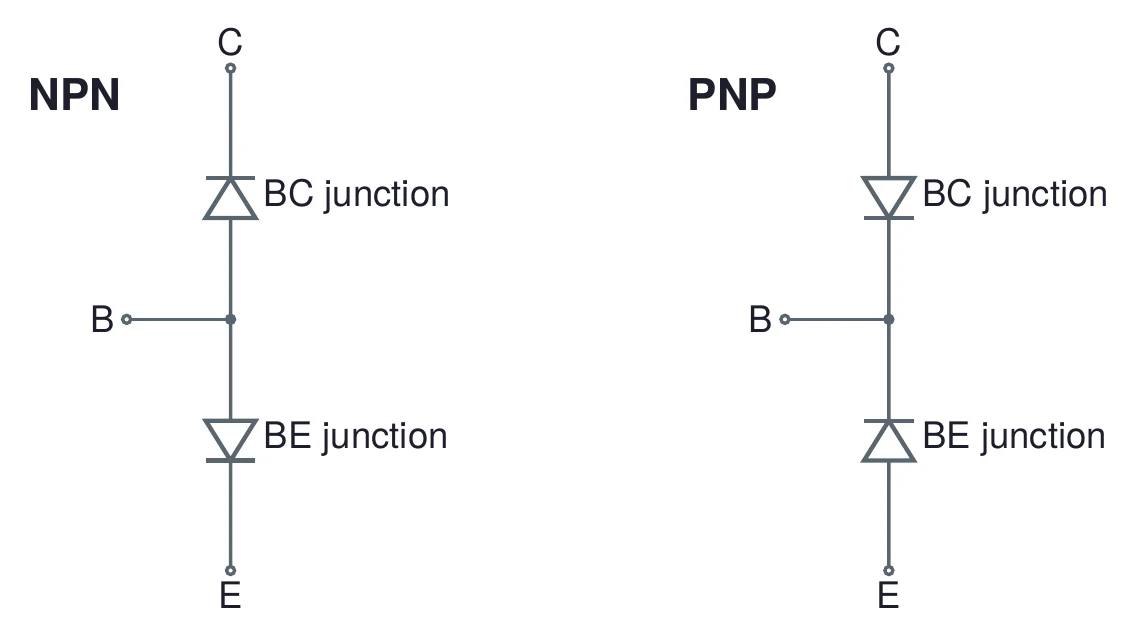
The two-diode model seen by a DMM. NPN: from the base, one diode points up to the collector (BC junction) and one points down to the emitter (BE junction), so both anodes are at the base. PNP: both diodes point into the base, from the collector and from the emitter.

NPN: both diodes point away from the base. PNP: both point toward it. The base is the lead they share.

© Ran Yang, Ph.D.Electronics
PHYS 252 · Lecture 0510

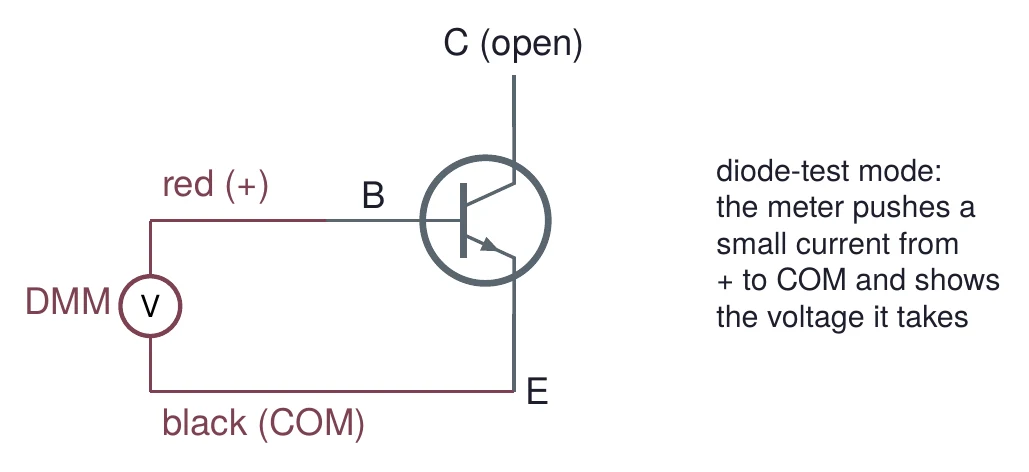
Diode-test mode on one junction

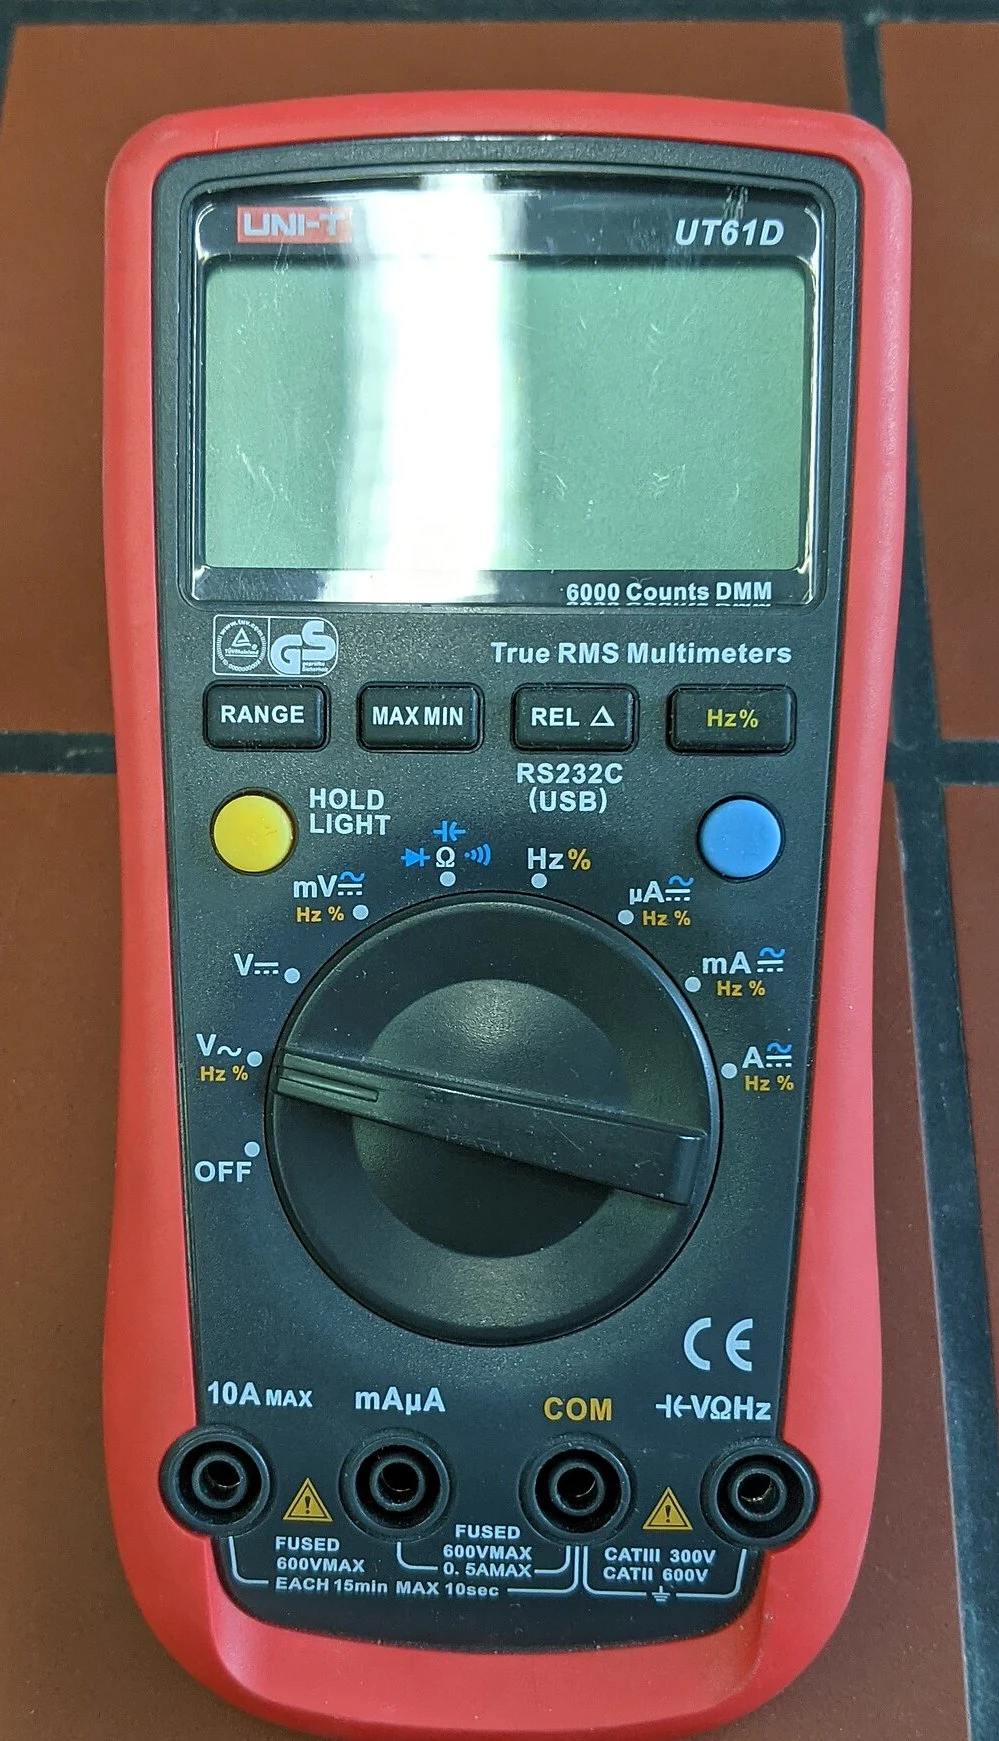
A handheld digital multimeter with a large display, a rotary range switch and four input jacks at the bottom.
A DMM in diode-test mode on an NPN transistor: the red (+) lead on the base, the black (COM) lead on the emitter, the collector left open. A note says the meter pushes a small current from + to COM and shows the voltage it takes.

Forward: a junction voltage. Reverse: OL (over limit). Photo: Anselm Schüler, CC BY-SA 4.0.

© Ran Yang, Ph.D.Electronics
PHYS 252 · Lecture 0511

Find the base and the type

Red (+)Black (COM)An NPN reads
BCa junction voltage
BEa junction voltage
CBOL
EBOL
CEOL both ways

The lead that conducts to both others with red on it is an NPN base. Work out the PNP pattern before you measure the 2N3906.

© Ran Yang, Ph.D.Electronics
PHYS 252 · Lecture 0512

Part 3 · Current gain β

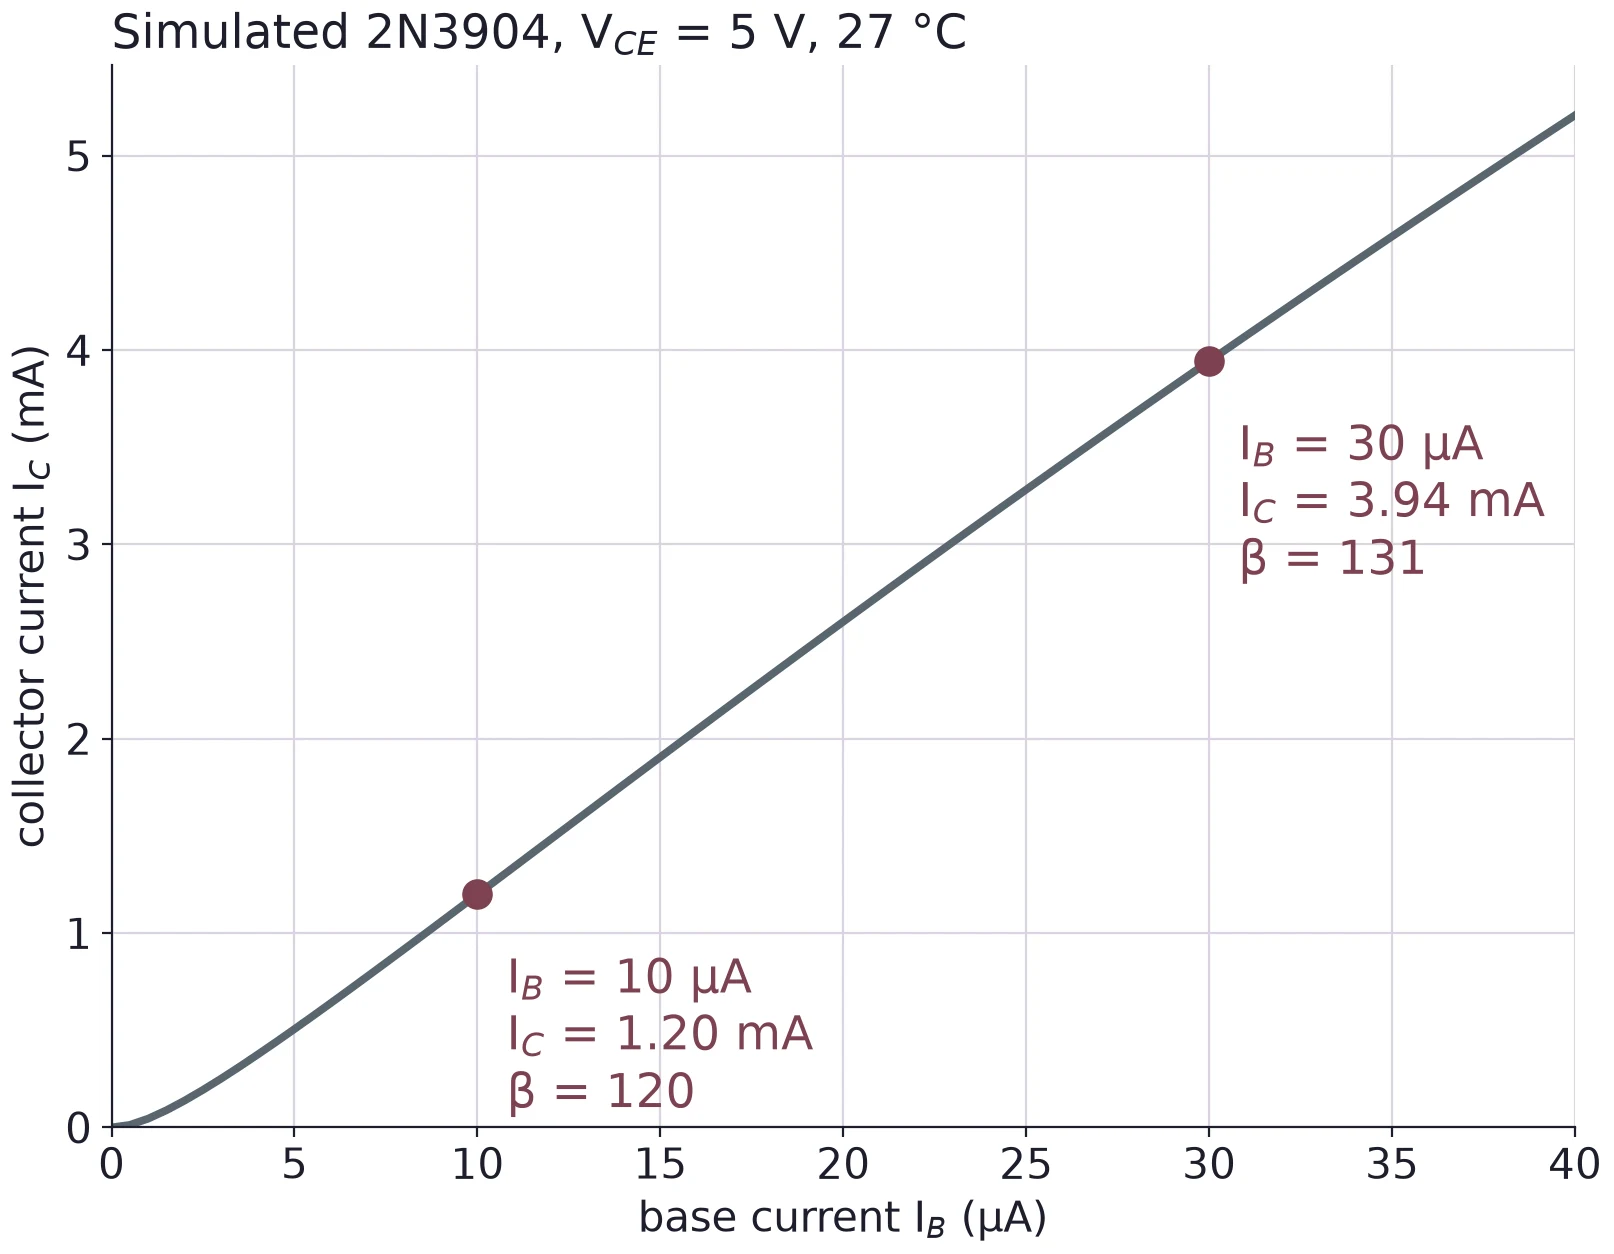
Example: ICI_C = 2.4 mA

and IBI_B = 12 µA

βdc=2.4 mA12 μA=200\beta_{dc} = \frac{2.4\ \text{mA}}{12\ \mu\text{A}} = 200

IE=2.412 mAI_E = 2.412\ \text{mA}

αdc=ICIE=0.9950\alpha_{dc} = \frac{I_C}{I_E} = 0.9950

Simulated collector current against base current for a 2N3904 (onsemi model) at V_CE = 5 V and 27 degrees C, I_B from 0 to 40 microamps. The curve is nearly a straight line rising to about 5.2 mA. Marked points: I_B = 10 microamps gives I_C = 1.20 mA, beta 120; I_B = 30 microamps gives I_C = 3.94 mA, beta 131.

Right: simulated with the onsemi model. β, the slope from the origin, changes along the curve.

© Ran Yang, Ph.D.Electronics
PHYS 252 · Lecture 0513

What the datasheet promises

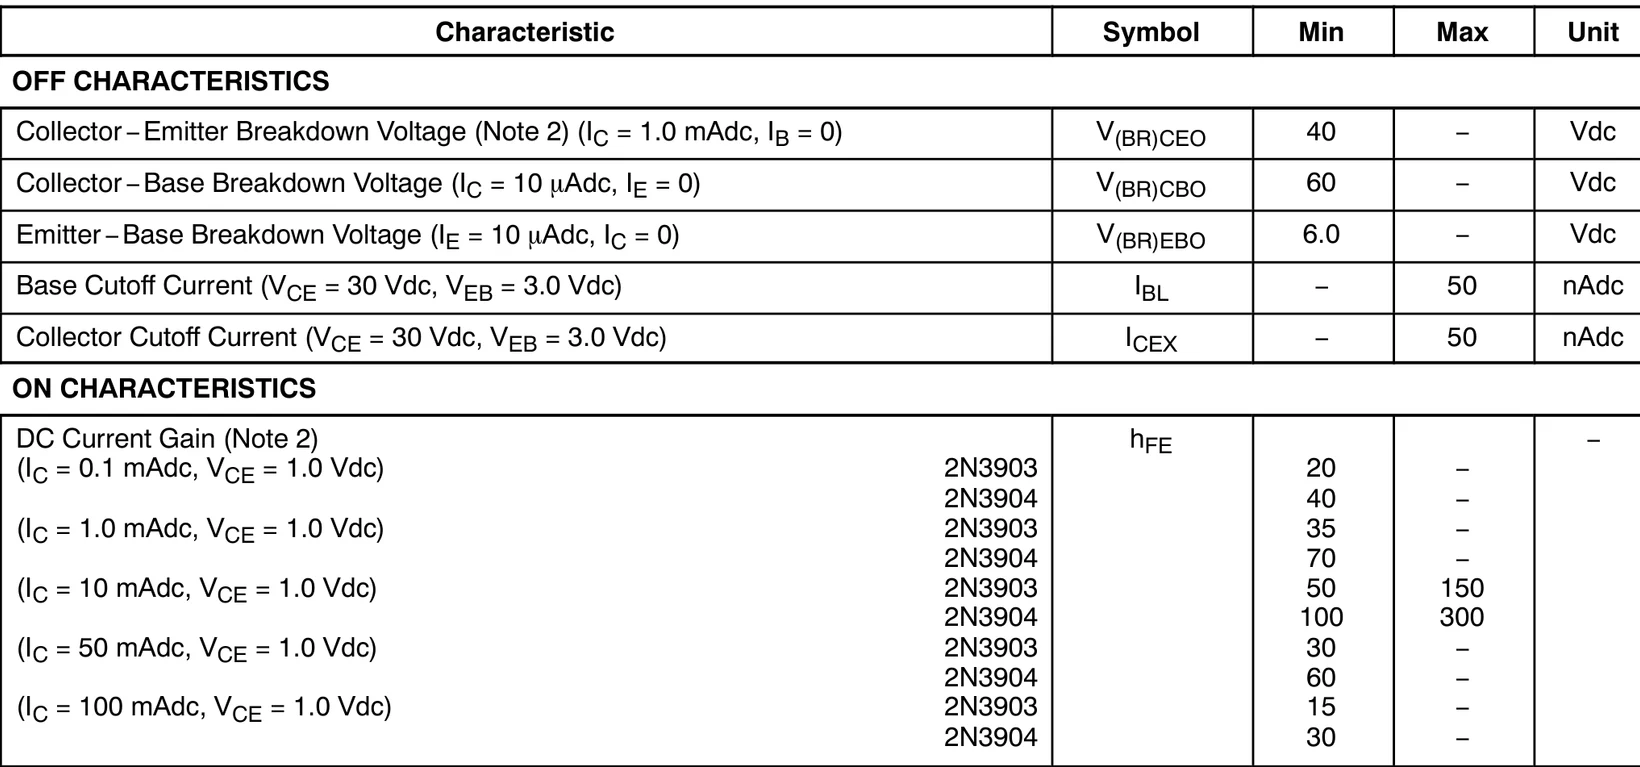
Part of the electrical characteristics table from the onsemi 2N3903 and 2N3904 datasheet. Off characteristics: collector to emitter breakdown voltage V(BR)CEO at least 40 V, collector to base 60 V, emitter to base 6.0 V, cutoff currents at most 50 nA. On characteristics, DC current gain hFE at V_CE = 1.0 V for the 2N3904: at least 40 at 0.1 mA, 70 at 1.0 mA, 100 to 300 at 10 mA, 60 at 50 mA and 30 at 100 mA; the 2N3903 rows are lower.

Read the 2N3904 rows: hFEh_{FE} = βdc\beta_{dc}. At 1 mA the datasheet only promises at least 70. At 10 mA, 100 to 300. Source: onsemi 2N3903/D, p. 2.

© Ran Yang, Ph.D.Electronics
PHYS 252 · Lecture 0514

β changes with current and temperature
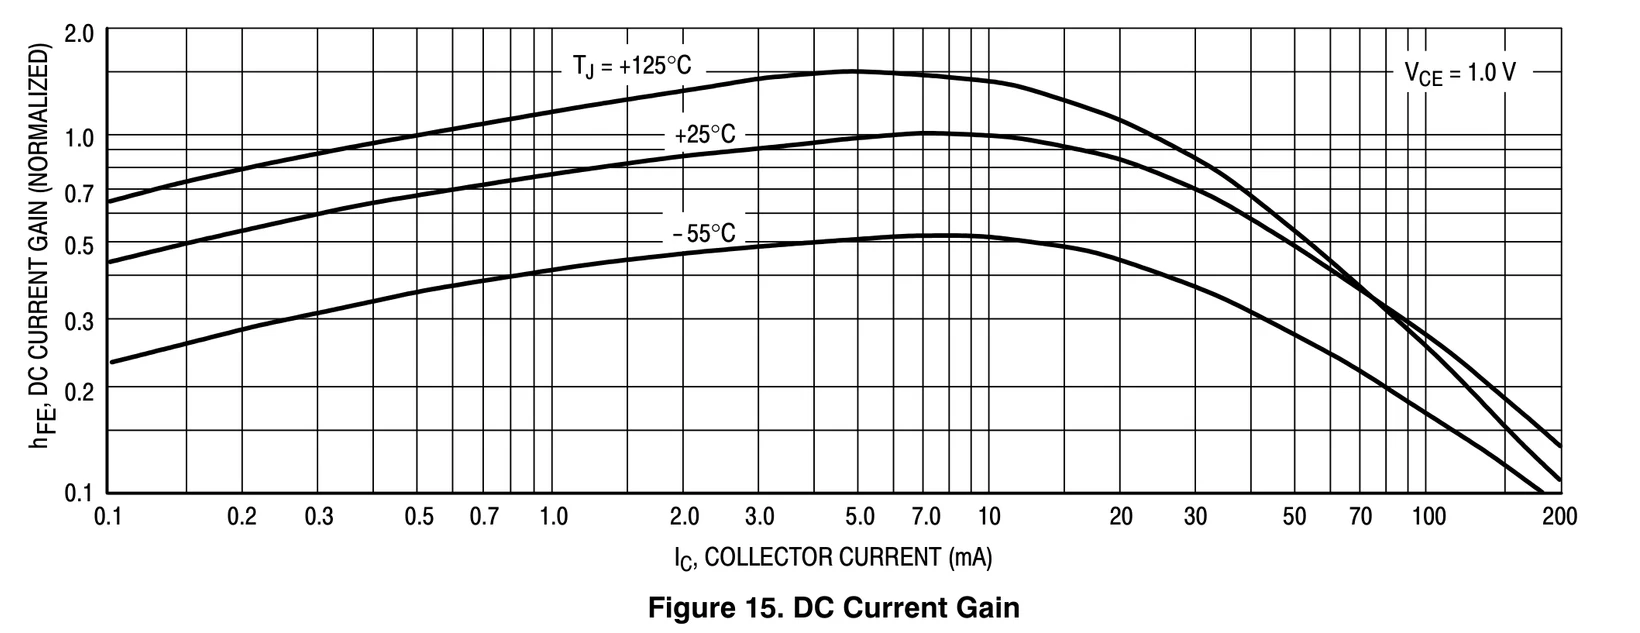
Figure 15 of the onsemi 2N3903 and 2N3904 datasheet: DC current gain, normalized, against collector current from 0.1 to 200 mA on log axes, at V_CE = 1.0 V, for junction temperatures of +125, +25 and -55 degrees C. Each curve rises gently to a peak between about 5 and 10 mA and falls at higher current; the hotter curve lies above the cooler ones over most of the range.

Small-signal (low-power) transistors: β about 100 to 300. Power transistors: about 20 to 100.

Normalized to the 25 °C peak. Source: onsemi 2N3903/D, Fig. 15.

© Ran Yang, Ph.D.Electronics
PHYS 252 · Lecture 0515

Part 4 · Double and single subscripts

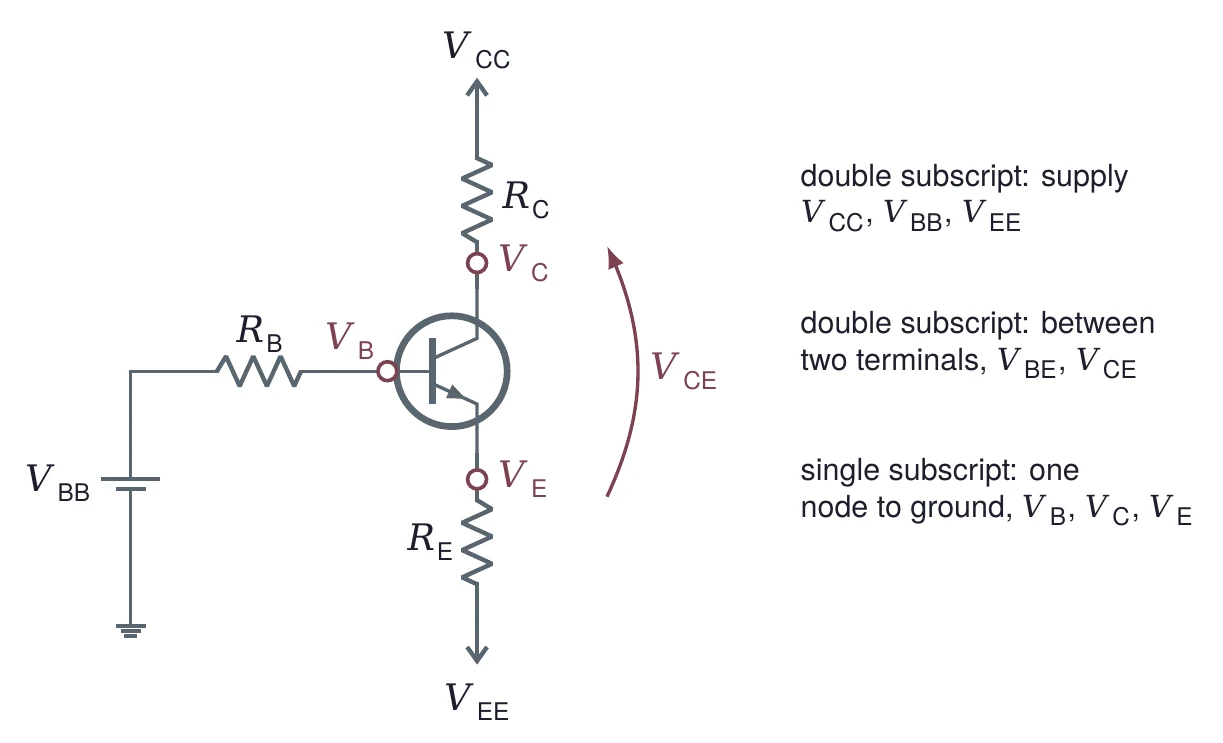
A transistor circuit labeled with the notation: a supply V_BB drives R_B into the base, R_C connects the collector to V_CC, and R_E connects the emitter to V_EE. Node voltages V_B, V_C and V_E are marked at the three terminals, and an arrow marks V_CE from emitter to collector. Notes: double subscripts name supplies (V_CC, V_BB, V_EE) or the voltage between two terminals (V_BE, V_CE); single subscripts name a node voltage to ground (V_B, V_C, V_E).

Upper case means DC. VBE=VB−VEV_{BE} = V_B - V_E and VCE=VC−VEV_{CE} = V_C - V_E.

© Ran Yang, Ph.D.Electronics
PHYS 252 · Lecture 0516

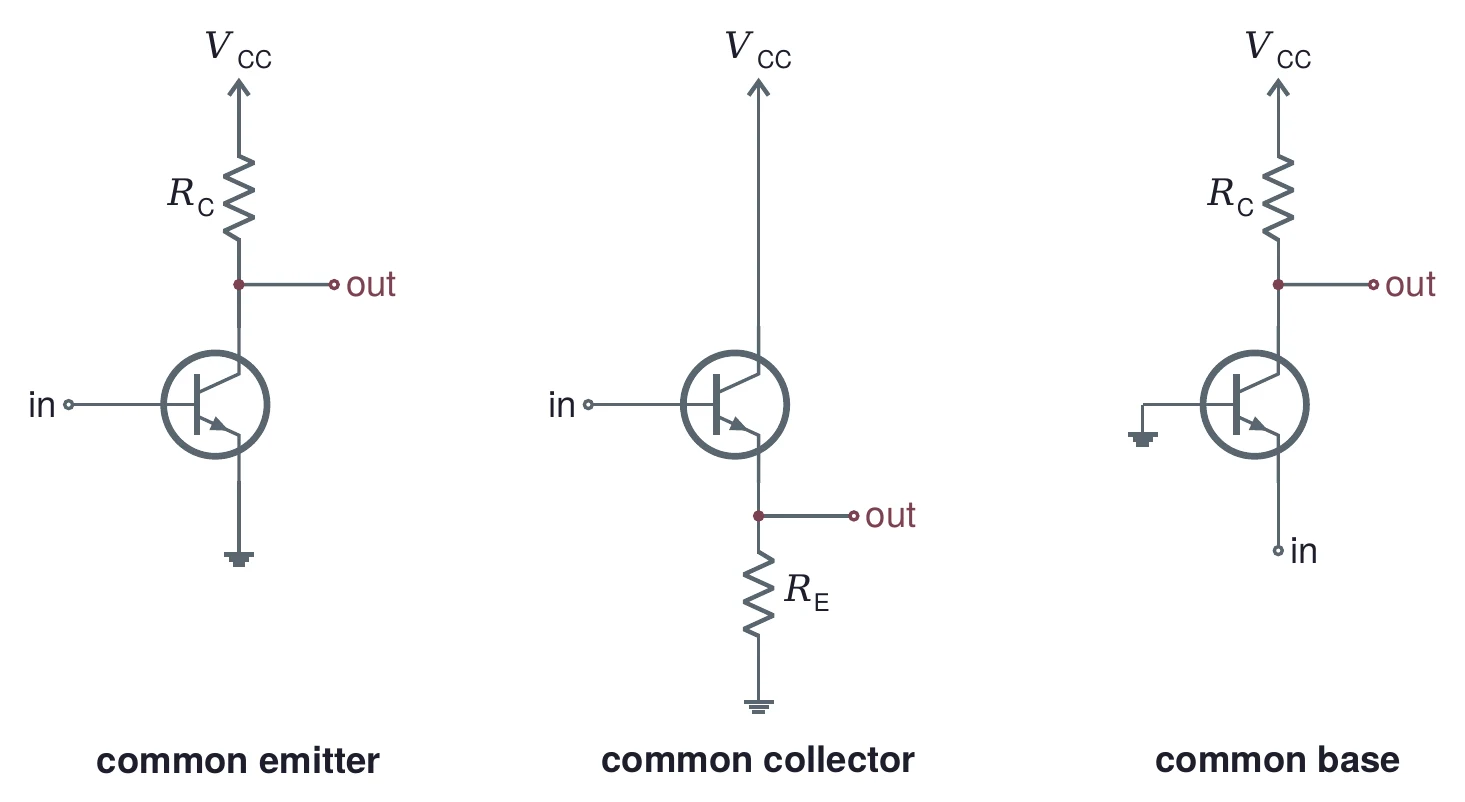
Three ways to connect a BJT

Three small circuits. Common emitter: input at the base, output at the collector, which connects to V_CC through R_C, emitter grounded. Common collector: input at the base, collector tied to V_CC, output at the emitter, which connects to ground through R_E. Common base: base grounded, input at the emitter, output at the collector with R_C to V_CC.

Named for the terminal that the input and output share. This lab biases a common-emitter stage; Lecture 06 turns it into an amplifier.

© Ran Yang, Ph.D.Electronics
PHYS 252 · Lecture 0517

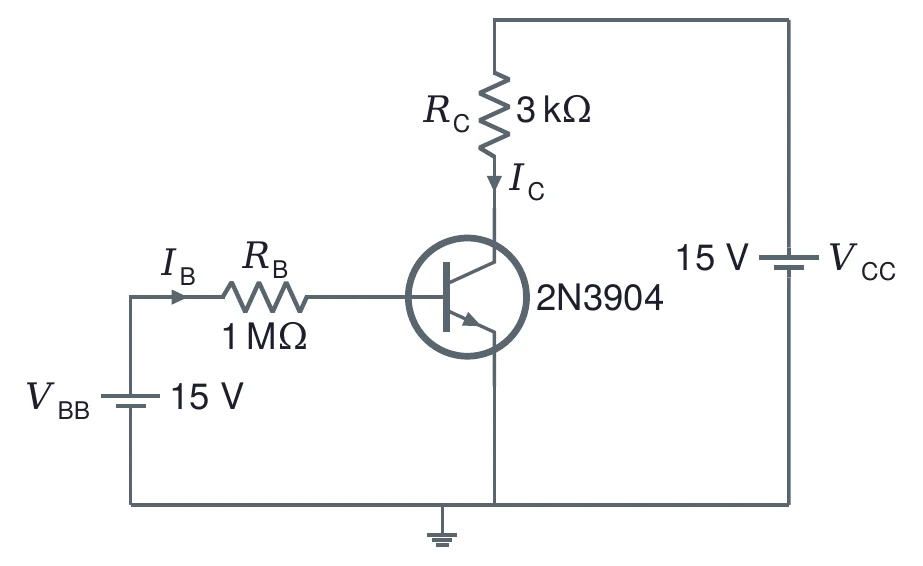
Base bias, step by step

Base bias: a 15 V source V_BB drives the base of a 2N3904 through R_B of 1 megohm, carrying I_B. The collector connects through R_C of 3 kilohms to a 15 V supply V_CC, carrying I_C. The emitter is grounded.

VB=VBE=0.7V_B = V_{BE} = 0.7 V

IB=15−0.71 MΩ=14.30 μAI_B = \dfrac{15 - 0.7}{1\ \text{M}\Omega} = 14.30\ \mu\text{A}

IC=βIB=1.430 mAI_C = \beta I_B = 1.430\ \text{mA}

IE=IC+IB=1.444 mAI_E = I_C + I_B = 1.444\ \text{mA}

The emitter is grounded, so VB=VBEV_B = V_{BE}. With β = 100: ICI_C = 100 × 14.30 µA.

© Ran Yang, Ph.D.Electronics
PHYS 252 · Lecture 0518

The collector voltage tells you where it sits
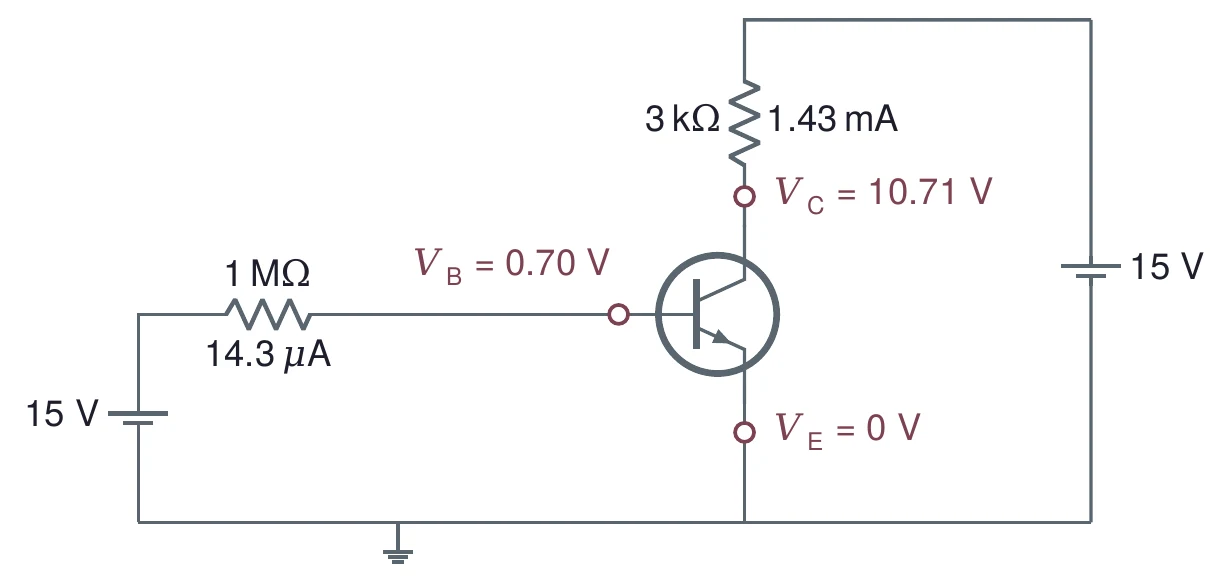
The base-bias circuit solved for beta = 100: 14.3 microamps through the 1 megohm resistor, V_B = 0.70 V at the base, 1.43 mA through the 3 kilohm collector resistor, V_C = 10.71 V at the collector, and V_E = 0 V at the grounded emitter.
VC=VCC−ICRC=15−1.430×3=10.71 VV_C = V_{CC} - I_C R_C = 15 - 1.430 \times 3 = 10.71\ \text{V}VCE=VC−VE=10.71−0=10.71 VV_{CE} = V_C - V_E = 10.71 - 0 = 10.71\ \text{V}

Well above 0.2 V and below the 15 V supply: active region.

© Ran Yang, Ph.D.Electronics
PHYS 252 · Lecture 0519

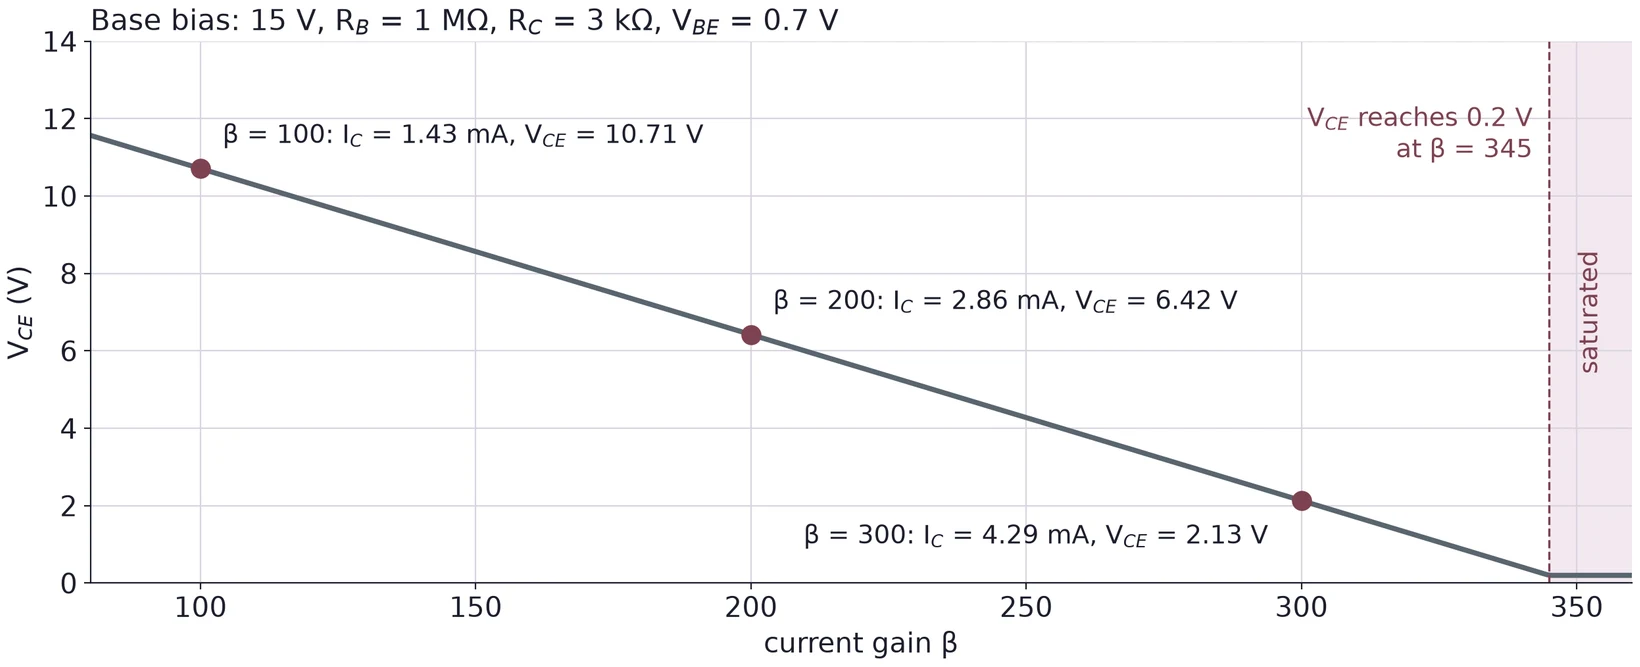
Base bias depends on β

V_CE against beta from 80 to 360 for the base-bias circuit with 15 V, R_B = 1 megohm, R_C = 3 kilohms and V_BE = 0.7 V. The line falls steadily: beta 100 gives I_C = 1.43 mA and V_CE = 10.71 V, beta 200 gives 2.86 mA and 6.42 V, beta 300 gives 4.29 mA and 2.13 V. V_CE reaches 0.2 V at beta = 345; beyond it a shaded band is marked saturated.

Swap one 2N3904 for another and β can double, and so does ICI_C. Near β = 345 the transistor saturates.

© Ran Yang, Ph.D.Electronics
PHYS 252 · Lecture 0520

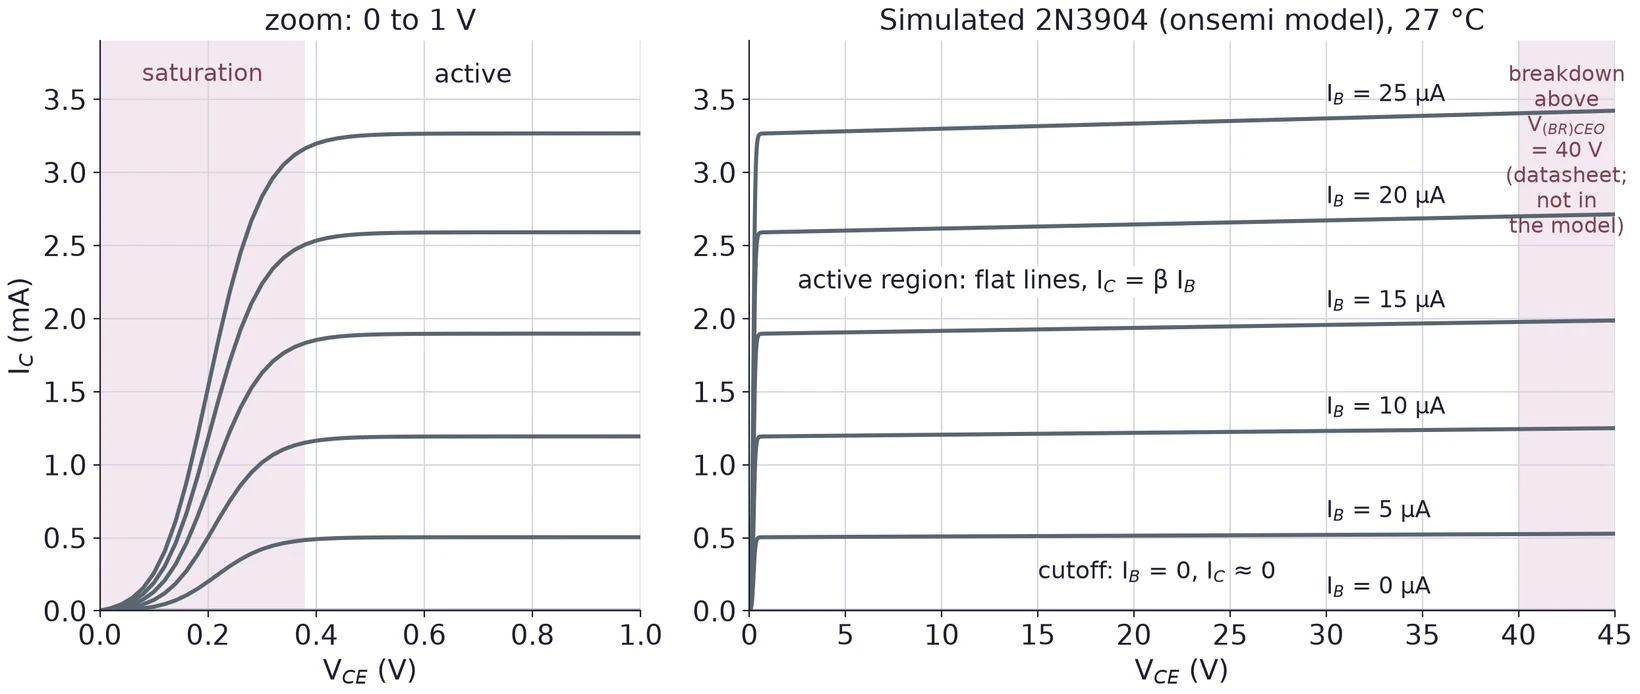
Part 5 · Output curves

Simulated output curves of a 2N3904 (onsemi model) at 27 degrees C: I_C against V_CE for I_B = 0, 5, 10, 15, 20 and 25 microamps. Left, a zoom from 0 to 1 V: each curve rises steeply and levels off by about 0.4 V; the rising part is shaded as saturation and the flat part labeled active. Right, from 0 to 45 V: flat lines at about 0.5, 1.2, 1.9, 2.6 and 3.3 mA labeled the active region, I_C = beta I_B; the I_B = 0 line sits at zero, labeled cutoff. Above 40 V a shaded band marks breakdown above V(BR)CEO = 40 V from the datasheet, not in the model.

Each curve holds IBI_B fixed. Above the knee, ICI_C hardly depends on VCEV_{CE}. This model has almost no Early slope; real curves tilt up a little.

© Ran Yang, Ph.D.Electronics
PHYS 252 · Lecture 0521

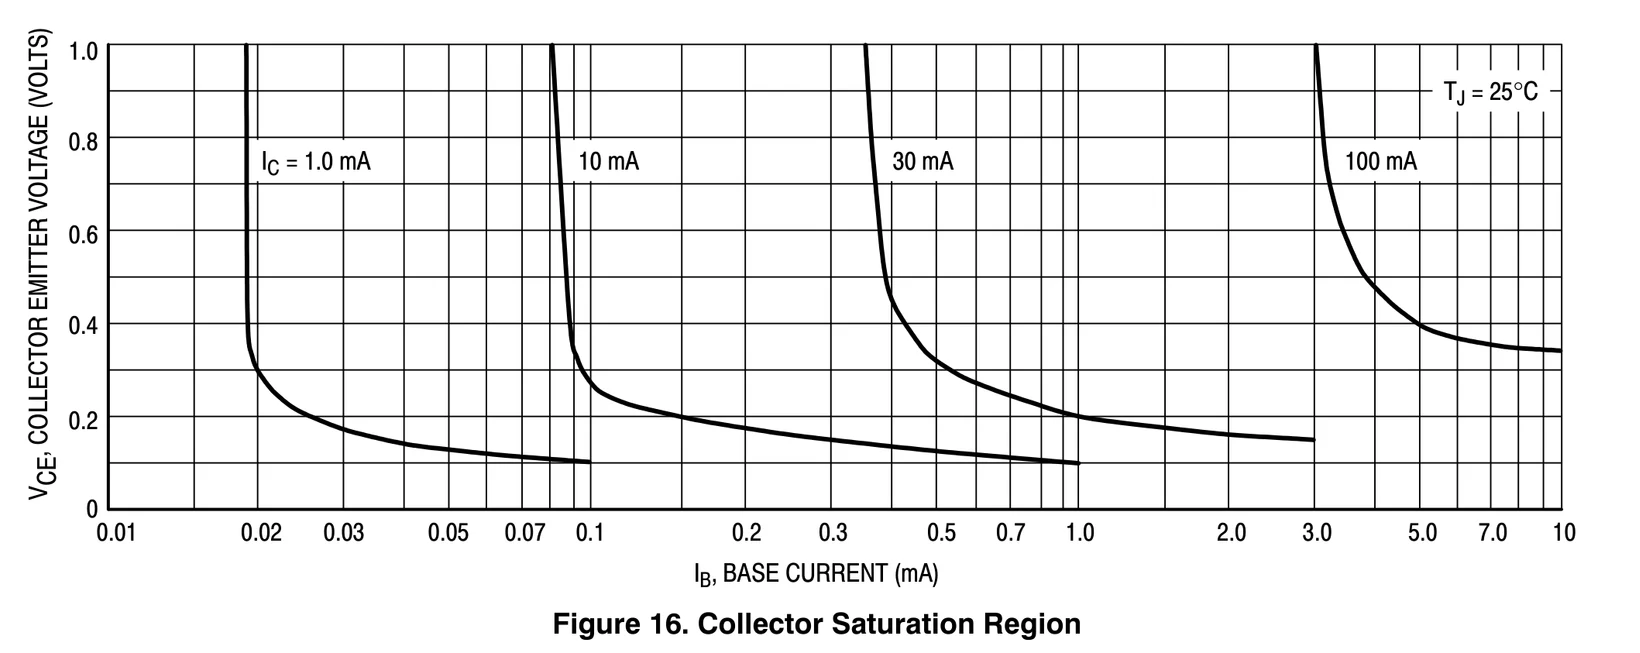
Saturation: the switch is closed

Figure 16 of the onsemi 2N3903 and 2N3904 datasheet, collector saturation region: V_CE from 0 to 1.0 V against base current from 0.01 to 10 mA on a log axis, at 25 degrees C, for collector currents of 1.0, 10, 30 and 100 mA. Each curve drops steeply once the base current is large enough, then flattens at a few tenths of a volt as I_B grows.

Give the base more current than IC/βI_C/\beta needs and VCEV_{CE} falls to a few tenths of a volt: the collector circuit can't supply more current. Source: onsemi 2N3903/D, Fig. 16.

© Ran Yang, Ph.D.Electronics
PHYS 252 · Lecture 0522

Which region?

RegionBE junctionBC junctionCheck
Cutoff (switch open)off: VBEV_{BE} too small to conductreverseIC≈0I_C \approx 0, VCE≈VCCV_{CE} \approx V_{CC}
Active (amplifier)forward, about 0.6 to 0.7 VreverseVCEV_{CE} well above 0.2 V; IC=βIBI_C = \beta I_B
Saturation (switch closed)forwardforwardVCEV_{CE} about 0.2 V or less; IC<βIBI_C < \beta I_B

In the lab: measure VBV_B, VCV_C, VEV_E, then check VBEV_{BE} and VCEV_{CE}.

© Ran Yang, Ph.D.Electronics
PHYS 252 · Lecture 0523

Part 6 · The divider holds the base voltage
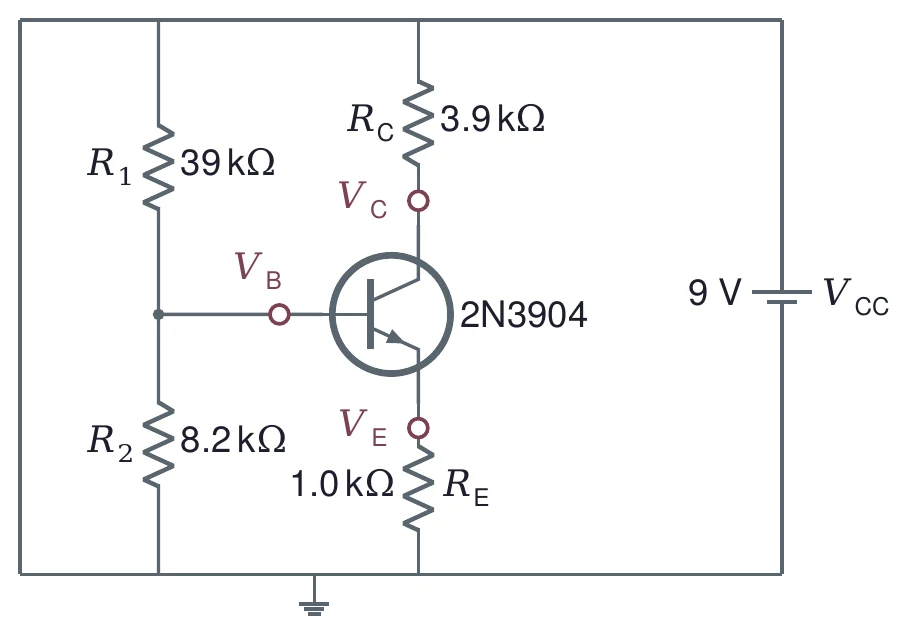
Voltage-divider bias of a 2N3904 from a 9 V supply V_CC: R_1 of 39 kilohms from the supply to the base node and R_2 of 8.2 kilohms from the base node to ground; R_C of 3.9 kilohms from the supply to the collector; R_E of 1.0 kilohm from the emitter to ground. The node voltages V_B, V_C and V_E are marked.

VB≈VCCR2R1+R2V_B \approx V_{CC}\dfrac{R_2}{R_1 + R_2}

VE=VB−0.7V_E = V_B - 0.7 V

IE=VE/RE≈ICI_E = V_E / R_E \approx I_C

VC=VCC−ICRCV_C = V_{CC} - I_C R_C

VCE=VC−VEV_{CE} = V_C - V_E

No β anywhere, as long as IBI_B is small next to the divider current.

© Ran Yang, Ph.D.Electronics
PHYS 252 · Lecture 0524

Seen from the base, the divider is a Thévenin source
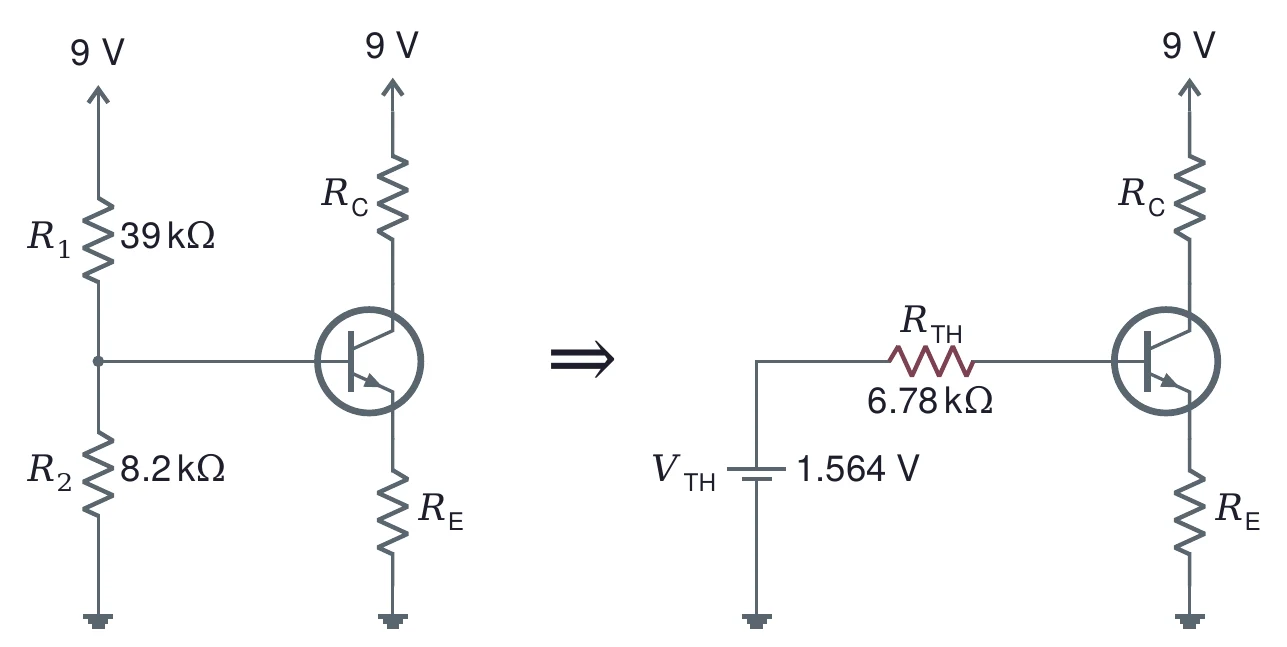
Left: the divider-bias circuit with R_1 = 39 kilohms and R_2 = 8.2 kilohms from 9 V feeding the base, R_C to 9 V and R_E to ground. An arrow points right to the equivalent: a Thevenin source V_TH = 1.564 V in series with R_TH = 6.78 kilohms driving the base, with the same R_C and R_E.
IE=VTH−VBERE+RTH/(β+1)firm when RTH<0.1 βREI_E = \frac{V_{TH} - V_{BE}}{R_E + R_{TH}/(\beta + 1)} \qquad \text{firm when } R_{TH} < 0.1\,\beta R_E

The divider sees (β+1)RE(\beta + 1)R_E as its load: Lecture 01's firm-source rule.

© Ran Yang, Ph.D.Electronics
PHYS 252 · Lecture 0525

Design steps 1 to 3: the emitter and collector

StepRule9 V, about 1 mA
1. Emitter voltageVE≈0.1 VCCV_E \approx 0.1\,V_{CC}VEV_E = 0.9 V
2. Emitter resistorRE=VE/IER_E = V_E / I_E0.9 V / 0.9 mA = 1.0 kΩ
3. Collector resistorVCE≈VCC/2V_{CE} \approx V_{CC}/2, so VC=VE+VCEV_C = V_E + V_{CE}VCV_C = 5.4 V; (9 − 5.4)/0.9 mA = 4.0 kΩ → 3.9 kΩ

A volt or so across RER_E makes the 0.7 V guess matter less. VCEV_{CE} at half the supply leaves room to swing both ways.

© Ran Yang, Ph.D.Electronics
PHYS 252 · Lecture 0526

Steps 4 to 6: pick R1 and R2

StepRule9 V circuit
4. Base voltageVB=VE+0.7V_B = V_E + 0.7 V1.6 V
5. Firm limitRTH<0.1 βminRER_{TH} < 0.1\,\beta_{min} R_E0.1 × 70 × 1.0 kΩ = 7.0 kΩ
6. Top resistorR1=RTH VCC/VBR_1 = R_{TH}\,V_{CC}/V_B39.4 kΩ → 39 kΩ
6. Bottom resistorR2=RTH VCC/(VCC−VB)R_2 = R_{TH}\,V_{CC}/(V_{CC} - V_B)8.51 kΩ → 8.2 kΩ

βmin\beta_{min} = 70: the datasheet's minimum at 1 mA. Check: RTH=39 kΩ∥8.2 kΩR_{TH} = 39\ \text{k}\Omega \parallel 8.2\ \text{k}\Omega = 6.78 kΩ passes.

© Ran Yang, Ph.D.Electronics
PHYS 252 · Lecture 0527

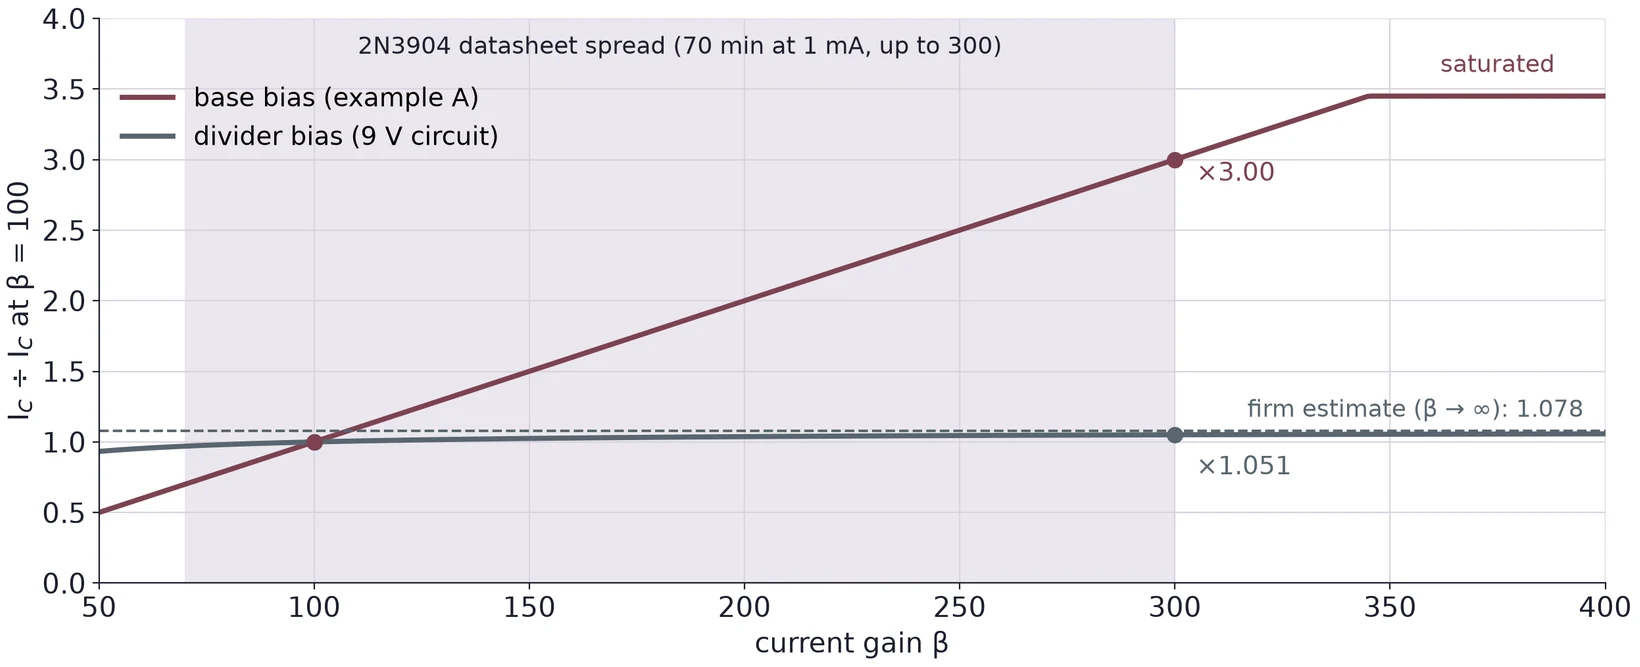
Recompute: β hardly matters now

Collector current relative to its value at beta = 100, against beta from 50 to 400. A shaded band from 70 to 300 marks the 2N3904 datasheet spread. Base bias (example A) rises in proportion to beta, reaching 3.00 times at beta = 300, and levels off at 3.45 times from beta = 345, where it saturates. Divider bias (the 9 V circuit) stays nearly flat, reaching 1.051 times at beta = 300 and approaching the dashed firm estimate of 1.078 for infinite beta.

At β = 100: ICI_C = 0.801 mA, VCEV_{CE} = 5.07 V. From β = 100 to 300, ICI_C rises 5 %; with base bias it triples.

© Ran Yang, Ph.D.Electronics
PHYS 252 · Lecture 0528

Too small wastes current, too large is not firm
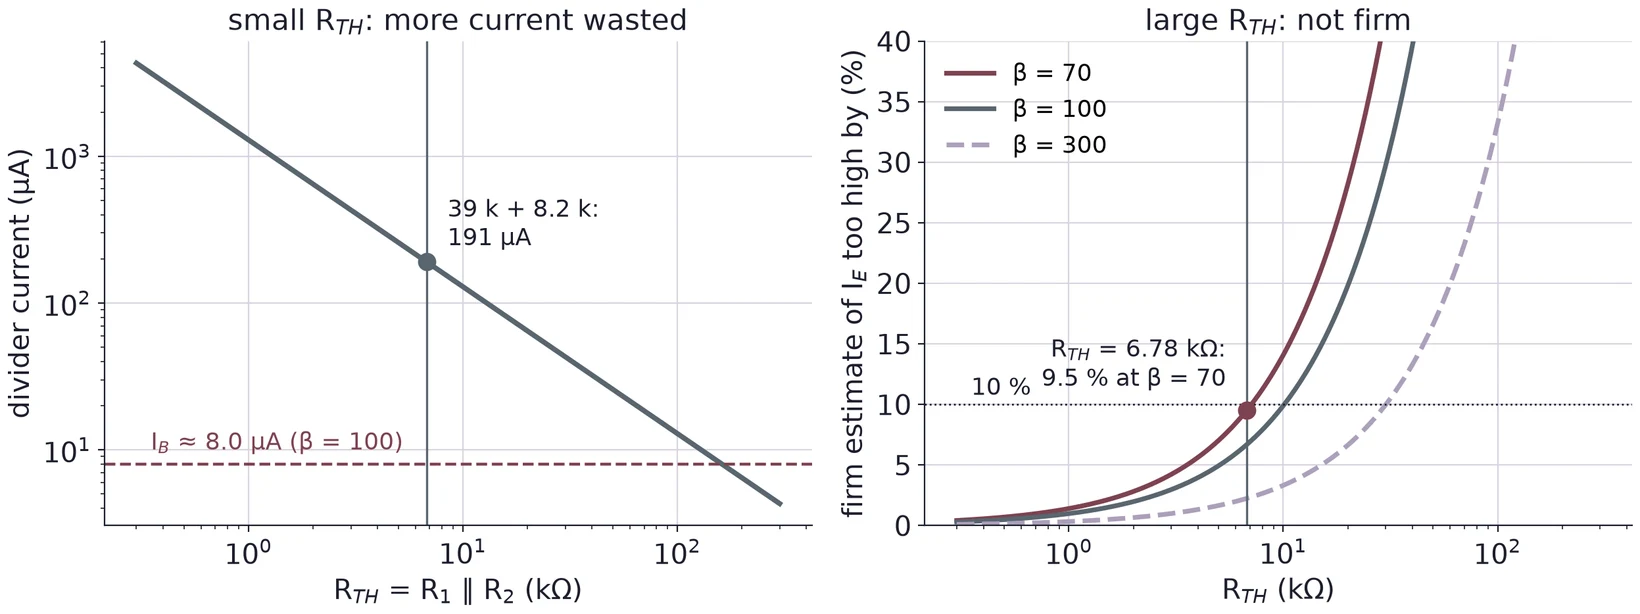
Two plots against R_TH, the divider's Thevenin resistance, from 0.3 to 300 kilohms, keeping the 9 V circuit's ratio. Left, log scales: the divider current falls from several milliamps to a few microamps; the 39 k plus 8.2 k divider draws 191 microamps, far above the base current of about 8.0 microamps at beta = 100, shown as a dashed line. Right: how far the firm estimate of I_E lies above the exact value, in percent, for beta = 70, 100 and 300; it grows with R_TH, and at R_TH = 6.78 kilohms it is 9.5 percent for beta = 70, just under the 10 percent line.

Our divider draws 191 µA, about 24 times IBI_B at β = 100. The divider current should be well above IBI_B.

© Ran Yang, Ph.D.Electronics
PHYS 252 · Lecture 0529

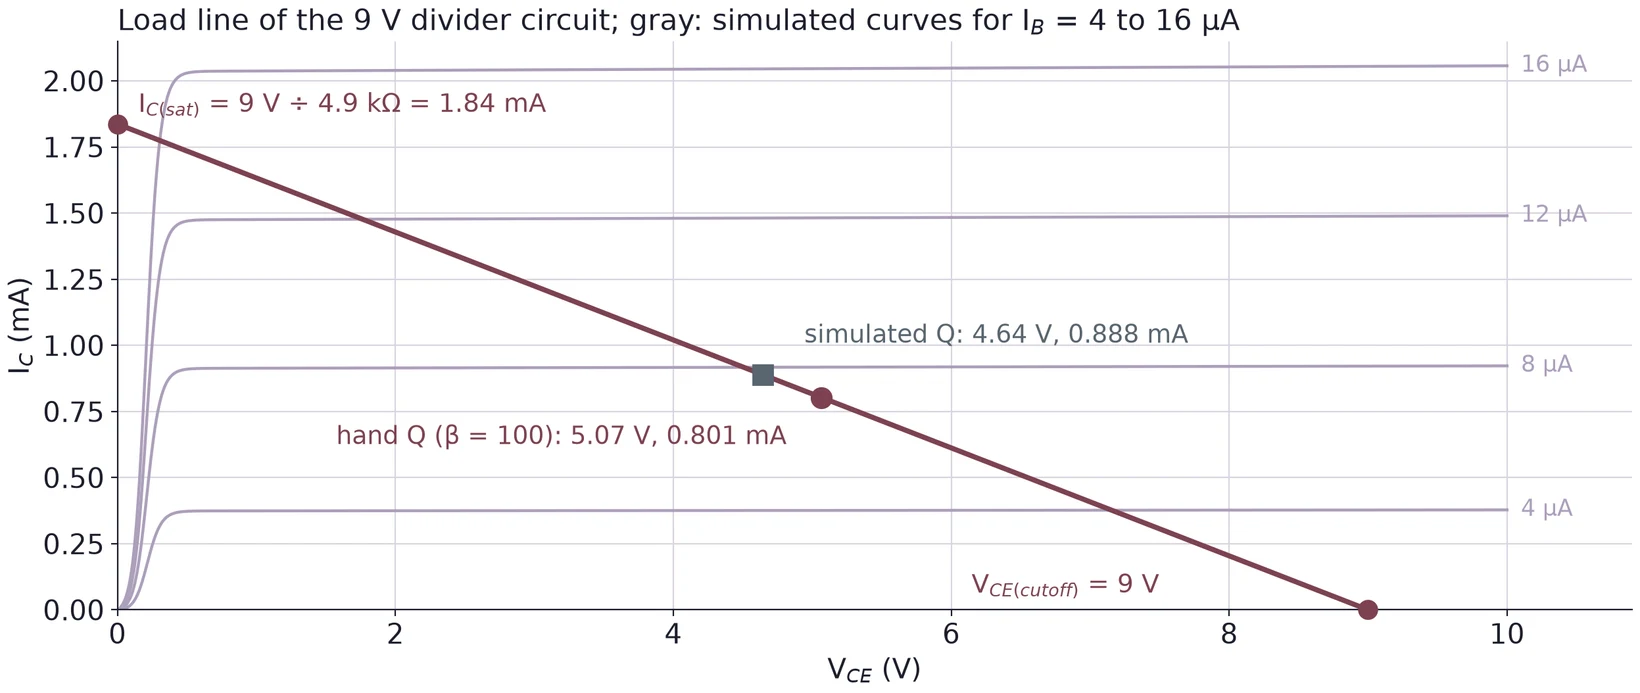
The DC load line and the Q point

DC load line of the 9 V divider circuit on I_C against V_CE axes: a straight line from I_C(sat) = 9 V divided by 4.9 kilohms = 1.84 mA at V_CE = 0 to V_CE(cutoff) = 9 V at zero current. Gray simulated output curves for I_B = 4, 8, 12 and 16 microamps cross it. The hand Q point for beta = 100 sits at 5.07 V and 0.801 mA; the simulated Q point at 4.64 V and 0.888 mA, near the 8 microamp curve.

Every operating point lies on the line VCE=VCC−IC(RC+RE)V_{CE} = V_{CC} - I_C(R_C + R_E). The Q point is where the bias puts it, near the middle.

© Ran Yang, Ph.D.Electronics
PHYS 252 · Lecture 0530

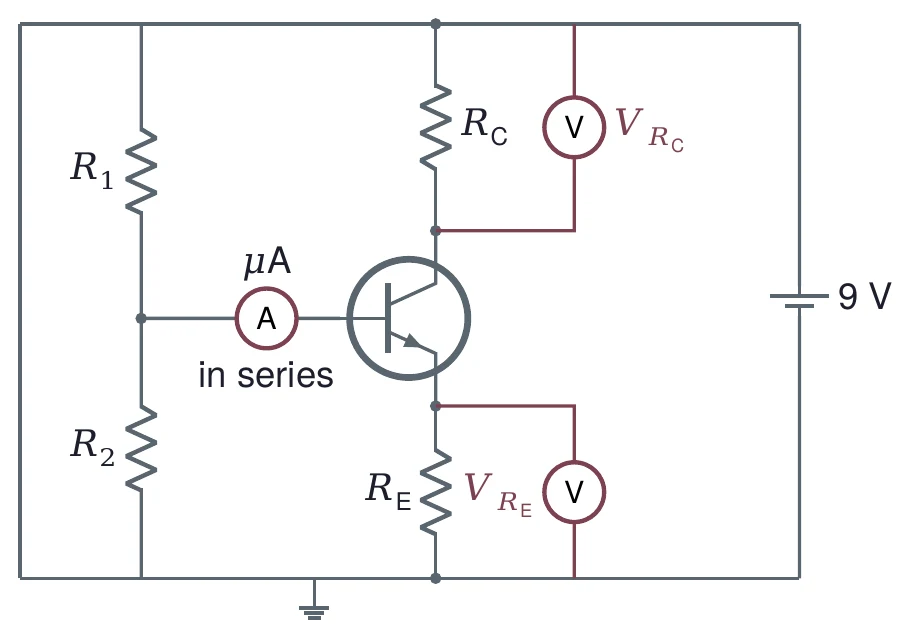
Part 7 · Currents from voltage drops

The divider-bias circuit with meters in place: a voltmeter across R_C reads V_RC, a voltmeter across R_E reads V_RE, and a microammeter in series between the divider node and the base reads I_B directly.

IE=VRE/REI_E = V_{R_E} / R_E

IC=VRC/RCI_C = V_{R_C} / R_C

Measure each resistor out of circuit first, and use the measured values.

The µA meter in series reads IBI_B directly; remove it before you measure the rest.

© Ran Yang, Ph.D.Electronics
PHYS 252 · Lecture 0531

Base current from a difference is a trap
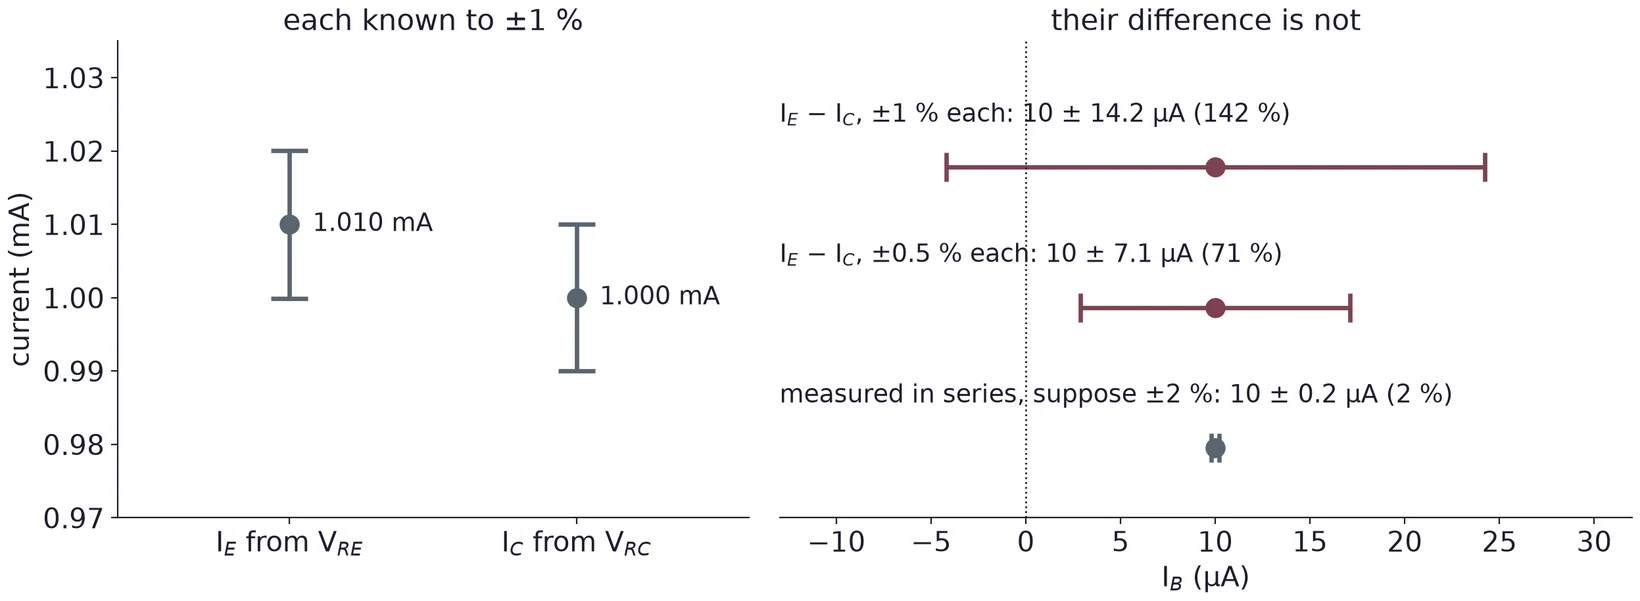
Left: I_E = 1.010 mA and I_C = 1.000 mA, each with a plus or minus 1 percent error bar; the bars overlap. Right: I_B from their difference is 10 plus or minus 14.2 microamps (142 percent) with 1 percent errors and 10 plus or minus 7.1 microamps (71 percent) with 0.5 percent errors, error bars reaching below zero; I_B measured in series, supposing plus or minus 2 percent, is 10 plus or minus 0.2 microamps.

IB=IE−ICI_B = I_E - I_C subtracts two nearly equal numbers: their small errors add, while the difference is tiny. Measure IBI_B another way.

© Ran Yang, Ph.D.Electronics
PHYS 252 · Lecture 0532

Hand calculation against simulation

9 V circuitHand: 0.7 V, β = 100ngspice, 27 °C
VBV_B1.509 V1.511 V
VEV_E0.809 V0.895 V
VCV_C5.875 V5.538 V
VCEV_{CE}5.066 V4.643 V
ICI_C0.801 mA0.888 mA
VBEV_{BE} and β0.700 V, 1000.615 V, 114.0

Put the model's 0.615 V and 114 into the hand formula and it matches ngspice to 1 mV. Both say active: VCEV_{CE} is far above 0.2 V.

© Ran Yang, Ph.D.Electronics
PHYS 252 · Lecture 0533

Part 8 · As it warms, the junction voltage falls
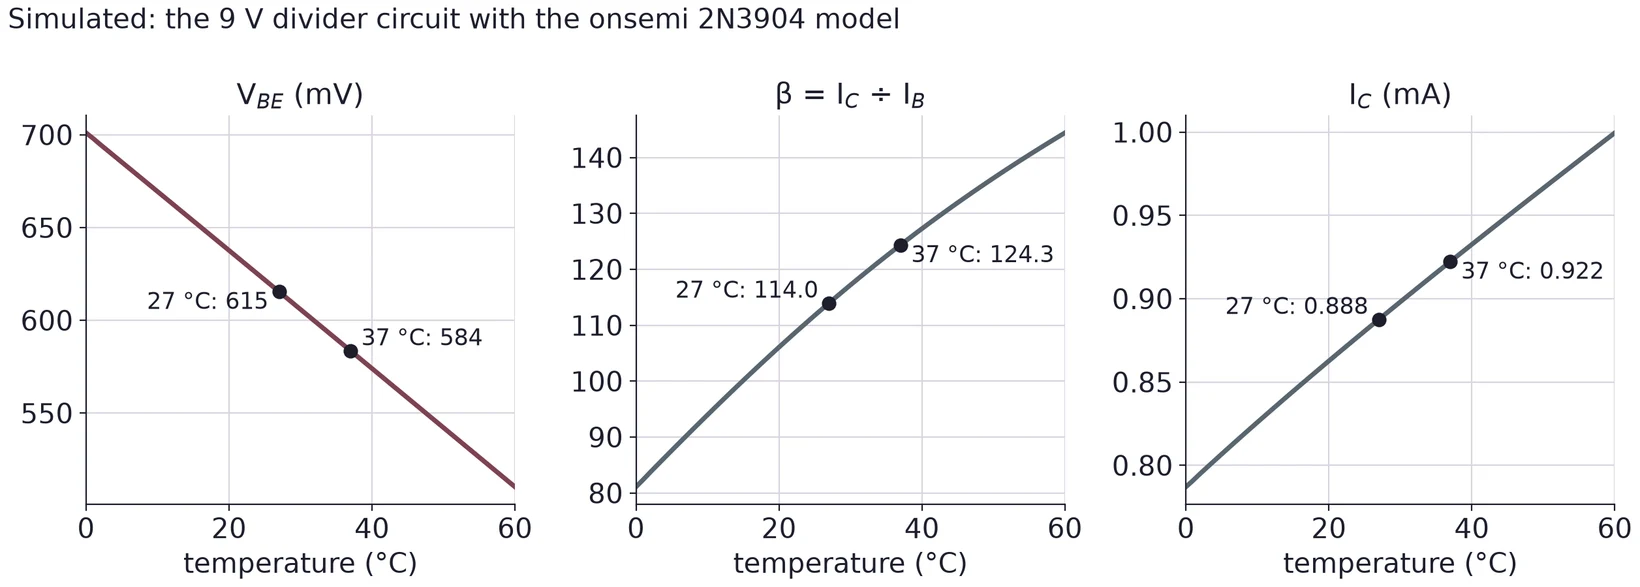
Three simulated plots of the 9 V divider circuit with the onsemi 2N3904 model, temperature from 0 to 60 degrees C. V_BE falls from about 700 mV to about 510 mV: 615 mV at 27 degrees and 584 mV at 37 degrees. Beta rises from about 81 to about 144: 114.0 at 27 degrees and 124.3 at 37 degrees. I_C rises from about 0.79 to 1.00 mA: 0.888 mA at 27 degrees and 0.922 mA at 37 degrees.

A silicon junction's VBEV_{BE} falls about 2 mV per °C at a fixed current. This model falls 3.2 mV/°C, more than a typical part, so don't quote it as typical.

© Ran Yang, Ph.D.Electronics
PHYS 252 · Lecture 0534

A temperature coefficient, worked

Suppose a fingertip warms the case about 10 °C (an estimate): VBEV_{BE} drops 20 mV, β rises 5 %.

VBE alone:IC +2.32 %,VCE −91 mVV_{BE}\ \text{alone}:\quad I_C\ {+2.32}\,\%, \quad V_{CE}\ {-91}\ \text{mV}with β too:IC: 0.8013→0.8227 mA (+2.67 %)\text{with}\ \beta\ \text{too}:\quad I_C:\ 0.8013 \to 0.8227\ \text{mA}\ (+2.67\,\%)VCE: 5.066→4.961 V (−105 mV)V_{CE}:\ 5.066 \to 4.961\ \text{V}\ (-105\ \text{mV})ΔVCEΔT=−10.5 mV/∘CΔIC/ICΔT=+0.27 %/∘C\frac{\Delta V_{CE}}{\Delta T} = -10.5\ \text{mV}/^\circ\text{C} \qquad \frac{\Delta I_C / I_C}{\Delta T} = +0.27\,\%/^\circ\text{C}

State the quantity, its unit and how you estimated ΔT.

© Ran Yang, Ph.D.Electronics
PHYS 252 · Lecture 0535

Base bias drifts more than divider bias
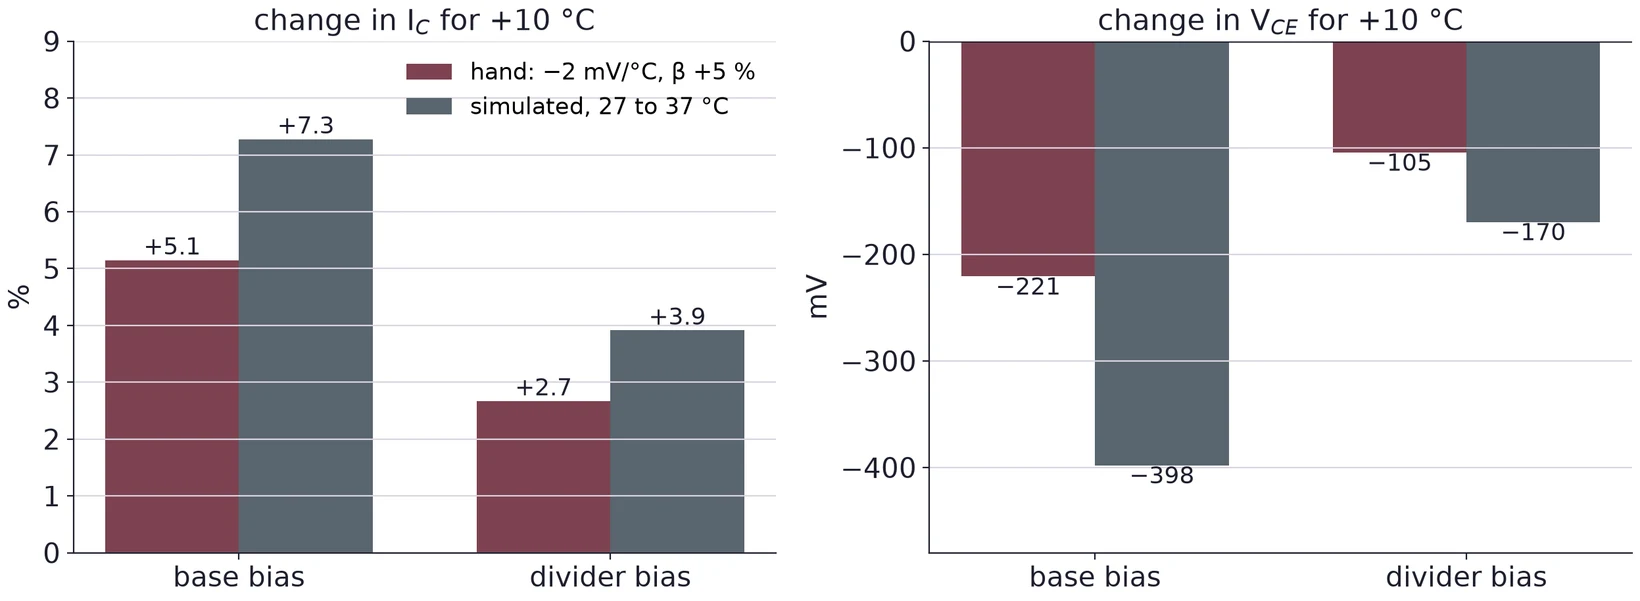
Bar charts for a 10 degree C rise, base bias against divider bias, hand estimate (V_BE minus 2 mV per degree, beta plus 5 percent) beside simulation (27 to 37 degrees). Change in I_C: base bias plus 5.1 percent by hand and plus 7.3 percent simulated; divider bias plus 2.7 percent and plus 3.9 percent. Change in V_CE: base bias minus 221 mV and minus 398 mV; divider bias minus 105 mV and minus 170 mV.

In base bias, IC=βIBI_C = \beta I_B follows every change in β. The divider and RER_E hold IEI_E close to (VTH−VBE)/RE(V_{TH} - V_{BE})/R_E, so only the VBEV_{BE} change gets through.

© Ran Yang, Ph.D.Electronics

Use ← → to move, Home / End to jump, and F for fullscreen.

Figure descriptions

Slide 2 · Part 1 · Lab 5 in five tasks

Lab 5 in three rows. Know the part: Task 1, a diode test on the 2N3904 and 2N3906 to find base, collector and emitter. Bias it: Task 2, build your divider bias and measure V_B, V_E and V_C; Task 3, find I_E and I_C from voltage drops, then I_B and beta; Task 4, check from V_CE that the transistor is in the active region. Warm it: Task 5, a fingertip on the case while you watch V_CE and I_C.

Slide 3 · Three layers, two junctions

Sketch of an NPN transistor as three blocks in a row: the emitter, N type and heavily doped, crowded with free electrons; a thin base, P type and lightly doped, with a few holes; and the collector, N type with medium doping and fewer electrons. Arrows mark the BE junction and the BC junction; leads E, B and C come out of the three regions. A note says the sketch is not to scale and a real base is far thinner.

Slide 4 · Inside a real 2N3904

A 2N3904 in its black plastic case, ground down to show a cross section. A small bright rectangle in the middle is the metal slug that carries the silicon die, with a fine bond wire above it; two leads leave the case on the right.

Slide 5 · NPN and PNP symbols

Circuit symbols for an NPN and a PNP transistor, each in a circle with base B on the left. NPN: collector at the top, emitter at the bottom, the emitter arrow pointing out. PNP: emitter at the top, collector at the bottom, the emitter arrow pointing in. Beside each, a downward arrow marks the direction of conventional current.

Slide 6 · The 2N3904 in a TO-92 package

A 2N3904 transistor in a small black TO-92 plastic package with its flat face toward the camera, marked 2N 3904, and three bent wire leads spread below it.

From the onsemi 2N3903 and 2N3904 datasheet: the NPN symbol with pin numbers, collector 3, base 2 and emitter 1, and drawings of the TO-92 package with straight leads and with bent leads, the leads numbered 1, 2, 3.

Slide 7 · Electrons cross the thin base

Sketch of electron flow in an NPN. The BE junction is forward biased and the BC junction reverse biased. Four arrows carry electrons from the emitter across the thin base into the collector; a curved arrow shows a few electrons recombining in the base and leaving through the base lead as I_B. Below, an arrow pointing the other way shows conventional current I_C flowing from collector to emitter, opposite to the electrons.

Slide 8 · Three currents, one node

An NPN transistor with three current arrows: I_B flows into the base, I_C flows into the collector, and I_E flows out of the emitter. Beside it: I_E = I_B + I_C, I_B is much less than I_C, and I_C is about equal to I_E.

Slide 9 · Part 2 · To the meter, a BJT is two diodes

The two-diode model seen by a DMM. NPN: from the base, one diode points up to the collector (BC junction) and one points down to the emitter (BE junction), so both anodes are at the base. PNP: both diodes point into the base, from the collector and from the emitter.

Slide 10 · Diode-test mode on one junction

A handheld digital multimeter with a large display, a rotary range switch and four input jacks at the bottom.

A DMM in diode-test mode on an NPN transistor: the red (+) lead on the base, the black (COM) lead on the emitter, the collector left open. A note says the meter pushes a small current from + to COM and shows the voltage it takes.

Slide 12 · Part 3 · Current gain β

Simulated collector current against base current for a 2N3904 (onsemi model) at V_CE = 5 V and 27 degrees C, I_B from 0 to 40 microamps. The curve is nearly a straight line rising to about 5.2 mA. Marked points: I_B = 10 microamps gives I_C = 1.20 mA, beta 120; I_B = 30 microamps gives I_C = 3.94 mA, beta 131.

Slide 13 · What the datasheet promises

Part of the electrical characteristics table from the onsemi 2N3903 and 2N3904 datasheet. Off characteristics: collector to emitter breakdown voltage V(BR)CEO at least 40 V, collector to base 60 V, emitter to base 6.0 V, cutoff currents at most 50 nA. On characteristics, DC current gain hFE at V_CE = 1.0 V for the 2N3904: at least 40 at 0.1 mA, 70 at 1.0 mA, 100 to 300 at 10 mA, 60 at 50 mA and 30 at 100 mA; the 2N3903 rows are lower.

Slide 14 · β changes with current and temperature

Figure 15 of the onsemi 2N3903 and 2N3904 datasheet: DC current gain, normalized, against collector current from 0.1 to 200 mA on log axes, at V_CE = 1.0 V, for junction temperatures of +125, +25 and -55 degrees C. Each curve rises gently to a peak between about 5 and 10 mA and falls at higher current; the hotter curve lies above the cooler ones over most of the range.

Slide 15 · Part 4 · Double and single subscripts

A transistor circuit labeled with the notation: a supply V_BB drives R_B into the base, R_C connects the collector to V_CC, and R_E connects the emitter to V_EE. Node voltages V_B, V_C and V_E are marked at the three terminals, and an arrow marks V_CE from emitter to collector. Notes: double subscripts name supplies (V_CC, V_BB, V_EE) or the voltage between two terminals (V_BE, V_CE); single subscripts name a node voltage to ground (V_B, V_C, V_E).

Slide 16 · Three ways to connect a BJT

Three small circuits. Common emitter: input at the base, output at the collector, which connects to V_CC through R_C, emitter grounded. Common collector: input at the base, collector tied to V_CC, output at the emitter, which connects to ground through R_E. Common base: base grounded, input at the emitter, output at the collector with R_C to V_CC.

Slide 17 · Base bias, step by step

Base bias: a 15 V source V_BB drives the base of a 2N3904 through R_B of 1 megohm, carrying I_B. The collector connects through R_C of 3 kilohms to a 15 V supply V_CC, carrying I_C. The emitter is grounded.

Slide 18 · The collector voltage tells you where it sits

The base-bias circuit solved for beta = 100: 14.3 microamps through the 1 megohm resistor, V_B = 0.70 V at the base, 1.43 mA through the 3 kilohm collector resistor, V_C = 10.71 V at the collector, and V_E = 0 V at the grounded emitter.

Slide 19 · Base bias depends on β

V_CE against beta from 80 to 360 for the base-bias circuit with 15 V, R_B = 1 megohm, R_C = 3 kilohms and V_BE = 0.7 V. The line falls steadily: beta 100 gives I_C = 1.43 mA and V_CE = 10.71 V, beta 200 gives 2.86 mA and 6.42 V, beta 300 gives 4.29 mA and 2.13 V. V_CE reaches 0.2 V at beta = 345; beyond it a shaded band is marked saturated.

Slide 20 · Part 5 · Output curves

Simulated output curves of a 2N3904 (onsemi model) at 27 degrees C: I_C against V_CE for I_B = 0, 5, 10, 15, 20 and 25 microamps. Left, a zoom from 0 to 1 V: each curve rises steeply and levels off by about 0.4 V; the rising part is shaded as saturation and the flat part labeled active. Right, from 0 to 45 V: flat lines at about 0.5, 1.2, 1.9, 2.6 and 3.3 mA labeled the active region, I_C = beta I_B; the I_B = 0 line sits at zero, labeled cutoff. Above 40 V a shaded band marks breakdown above V(BR)CEO = 40 V from the datasheet, not in the model.

Slide 21 · Saturation: the switch is closed

Figure 16 of the onsemi 2N3903 and 2N3904 datasheet, collector saturation region: V_CE from 0 to 1.0 V against base current from 0.01 to 10 mA on a log axis, at 25 degrees C, for collector currents of 1.0, 10, 30 and 100 mA. Each curve drops steeply once the base current is large enough, then flattens at a few tenths of a volt as I_B grows.

Slide 23 · Part 6 · The divider holds the base voltage

Voltage-divider bias of a 2N3904 from a 9 V supply V_CC: R_1 of 39 kilohms from the supply to the base node and R_2 of 8.2 kilohms from the base node to ground; R_C of 3.9 kilohms from the supply to the collector; R_E of 1.0 kilohm from the emitter to ground. The node voltages V_B, V_C and V_E are marked.

Slide 24 · Seen from the base, the divider is a Thévenin source

Left: the divider-bias circuit with R_1 = 39 kilohms and R_2 = 8.2 kilohms from 9 V feeding the base, R_C to 9 V and R_E to ground. An arrow points right to the equivalent: a Thevenin source V_TH = 1.564 V in series with R_TH = 6.78 kilohms driving the base, with the same R_C and R_E.

Slide 27 · Recompute: β hardly matters now

Collector current relative to its value at beta = 100, against beta from 50 to 400. A shaded band from 70 to 300 marks the 2N3904 datasheet spread. Base bias (example A) rises in proportion to beta, reaching 3.00 times at beta = 300, and levels off at 3.45 times from beta = 345, where it saturates. Divider bias (the 9 V circuit) stays nearly flat, reaching 1.051 times at beta = 300 and approaching the dashed firm estimate of 1.078 for infinite beta.

Slide 28 · Too small wastes current, too large is not firm

Two plots against R_TH, the divider's Thevenin resistance, from 0.3 to 300 kilohms, keeping the 9 V circuit's ratio. Left, log scales: the divider current falls from several milliamps to a few microamps; the 39 k plus 8.2 k divider draws 191 microamps, far above the base current of about 8.0 microamps at beta = 100, shown as a dashed line. Right: how far the firm estimate of I_E lies above the exact value, in percent, for beta = 70, 100 and 300; it grows with R_TH, and at R_TH = 6.78 kilohms it is 9.5 percent for beta = 70, just under the 10 percent line.

Slide 29 · The DC load line and the Q point

DC load line of the 9 V divider circuit on I_C against V_CE axes: a straight line from I_C(sat) = 9 V divided by 4.9 kilohms = 1.84 mA at V_CE = 0 to V_CE(cutoff) = 9 V at zero current. Gray simulated output curves for I_B = 4, 8, 12 and 16 microamps cross it. The hand Q point for beta = 100 sits at 5.07 V and 0.801 mA; the simulated Q point at 4.64 V and 0.888 mA, near the 8 microamp curve.

Slide 30 · Part 7 · Currents from voltage drops

The divider-bias circuit with meters in place: a voltmeter across R_C reads V_RC, a voltmeter across R_E reads V_RE, and a microammeter in series between the divider node and the base reads I_B directly.

Slide 31 · Base current from a difference is a trap

Left: I_E = 1.010 mA and I_C = 1.000 mA, each with a plus or minus 1 percent error bar; the bars overlap. Right: I_B from their difference is 10 plus or minus 14.2 microamps (142 percent) with 1 percent errors and 10 plus or minus 7.1 microamps (71 percent) with 0.5 percent errors, error bars reaching below zero; I_B measured in series, supposing plus or minus 2 percent, is 10 plus or minus 0.2 microamps.

Slide 33 · Part 8 · As it warms, the junction voltage falls

Three simulated plots of the 9 V divider circuit with the onsemi 2N3904 model, temperature from 0 to 60 degrees C. V_BE falls from about 700 mV to about 510 mV: 615 mV at 27 degrees and 584 mV at 37 degrees. Beta rises from about 81 to about 144: 114.0 at 27 degrees and 124.3 at 37 degrees. I_C rises from about 0.79 to 1.00 mA: 0.888 mA at 27 degrees and 0.922 mA at 37 degrees.

Slide 35 · Base bias drifts more than divider bias

Bar charts for a 10 degree C rise, base bias against divider bias, hand estimate (V_BE minus 2 mV per degree, beta plus 5 percent) beside simulation (27 to 37 degrees). Change in I_C: base bias plus 5.1 percent by hand and plus 7.3 percent simulated; divider bias plus 2.7 percent and plus 3.9 percent. Change in V_CE: base bias minus 221 mV and minus 398 mV; divider bias minus 105 mV and minus 170 mV.